Category: Natural Resources

WCM Chart for June 2, 2022

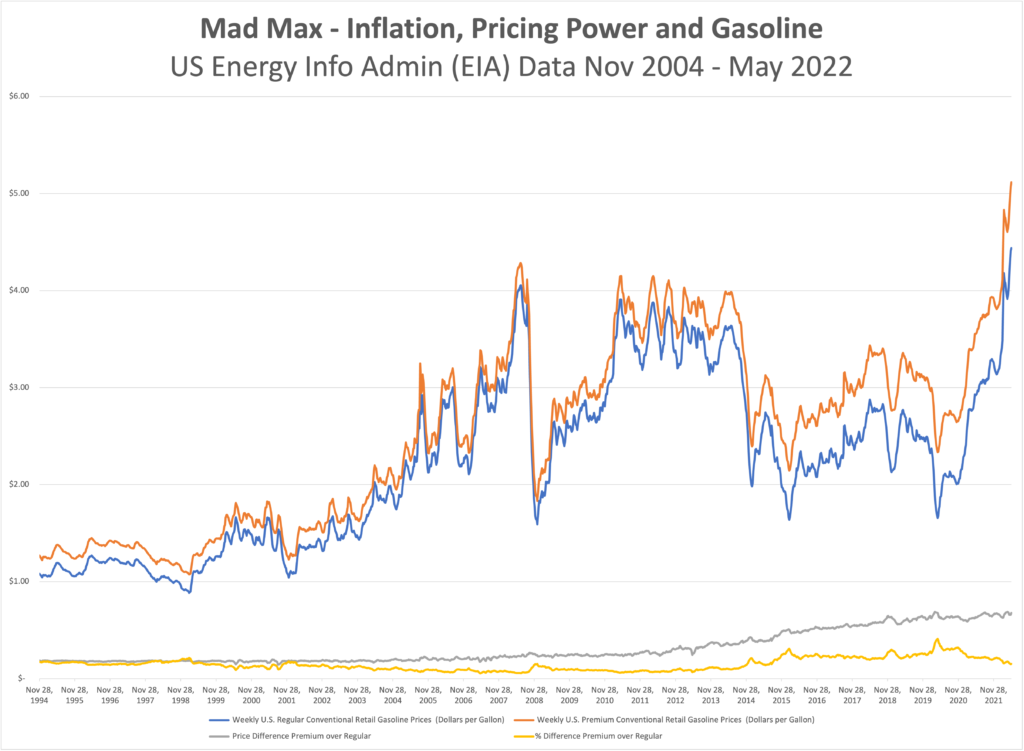
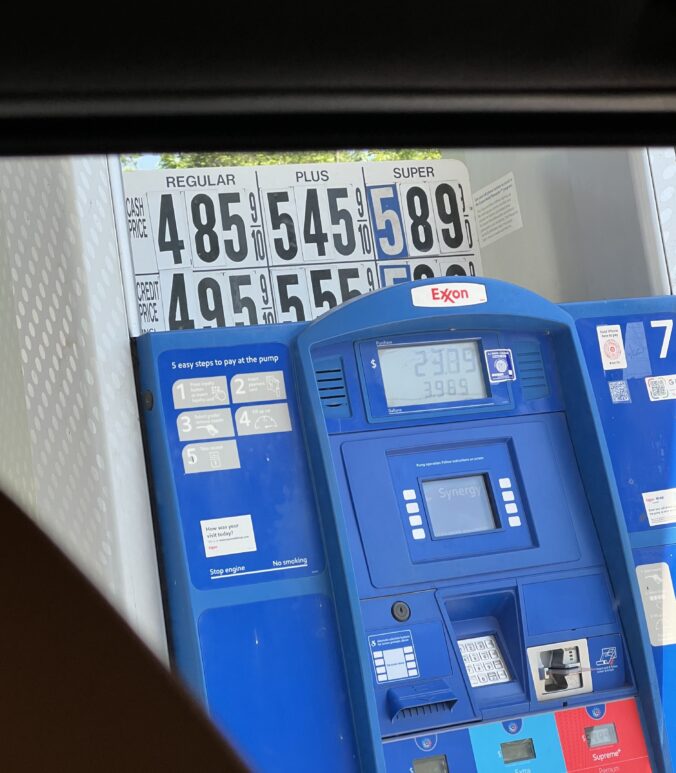
What’s up with gas? Inflation is everywhere, but it is hard to normalize when we are having the breakfast table conversations about how much prices have climbed. Our shopping carts are different from each other’s and aren’t always consistent from one trip to the next, but we get a general sense that the final tally is higher but the receipt isn’t any longer. One thing most of us, with the exception of certain urban dwellers and the small population of EV drivers, do have in common though is the price of gas. There is some geographic dispersion because of cost of delivery and local/state taxes, but we all buy the same three or four grades of gasoline, measure it in gallons, pay for it in dollars, and unless we change vehicles from one fill to the next, consume it at roughly the same rate per mile driven. This chart won’t reveal the mysteries of why prices are up, but there are a few interesting takeaways that show that there aren’t likely any easy answers. Maybe the most notable observation is that gasoline has gotten more expensive than the prior all-time peak in 2008 (about 11% higher right now). What isn’t on the graph is that oil (WTI Cushing) is about 21% cheaper than it was during the ’08 bubble.

Back to the chart, we can see that the spread between premium and regular gas has been steadily grinding higher for years, with few interruptions in the relationship outside of brief reactions to the Tech Bubble, 9/11, the Financial Crisis, etc. For those old enough to remember, it was bankable that mid-grade was 10 cents more than regular, and premium was ten cents more than that. Now that premium/regular spread hovers between 65 and 70 cents, today and two years ago when everyone was hunkered down at home. These figures would indicate that the petro industry still enjoys tremendous pricing power. When thinking about inflation it is important to consider what the drivers are and who gets hurt, but also who benefits. It was almost exactly 11 years ago when WTI was the same price it is today ($112/bbl). Regular was $3.91, and Premium was $4.15. Today at $112/bbl, Regular is $4.44 and Premium $5.12. [chart © WCM 2022, national data from US Energy Information Administration (EIA)]

WCM Chart of the Week for April 14, 2022

Let’s talk about something that proves that short-sighted or wrong-headed decisionmaking in ESG is bipartisan. One of the incredibly unfortunate halo effects of the Ukraine conflict is the global food shortage caused by Europe’s breadbasket being at war and the sanctions limiting access to Russian natural gas (key source for fertilizer). In addition to placing at risk a large percentage of the world population that are already nutritionally insecure, it has the effect of driving up commodity and food prices in the developed West. As we have discussed in prior blogs and newsletters, the conflict has also destabilized the petroleum market because of Russia’s role as a petrostate. The US is effectively energy independent, or nearly so if we look at all of North America together, but no question energy prices are higher. So what’s an American to do in the face of a global food and energy crisis? The US administration has an answer – put food in your gas tank. The decision to move to E15, 15% anhydrous denatured alcohol in the fuel mix, for the Summer arguably makes the whole situation worse. Referring to the US Energy Information Administration, the ASTM D4806 specification for ethanol compatible with spark-ignition engines is produced by “fermenting the sugar in the starches of grains such as corn, sorghum, and barley, and the sugar in sugar cane and sugar beets”. The first chart is from the USDA Foreign Agricultural Service and shows just how material Ukraine is to the global food supply. The second from the USDA statistics service shows already how much US corn production goes to fuel. There is a whole additional discussion to be had about the sense or senselessness of grain and cane crops being turned into fuel, from the energy intensity of the chemical conversion to the natural gas used to make fertilizer to the diesel burned for farm equipment to the climate costs of unsustainable monocrop farming practices that strongly suggests shortening the path from drill bit to burner tip is more efficient. But right now, we are focusing on the fact the US could (profitably) ameliorate rising food scarcity and prices with the same agricultural products it is planning to ferment and burn to save 10 cents on a $5 gallon of gas at the pump.

WCM Chart of the Week for April 4, 2022

With the release of “Climate Change 2022: Mitigation of climate change”, which is the third segment of this year’s sixth assessment report (AR6) from the IPCC, most of the attention will be focused again on the doomsday charts. One of the notable ones in the press packet is entitled “We are not on track to limit warming to 1.5 (deg) C.” But, the report is surprisingly optimistic in one very critical sense – it declares the problem addressable if global action is taken promptly and capital is called in off the sidelines to drive a transition in energy, land use, industry, urban zones, buildings and transportation that could halve GhG emissions by 2030. At this point the debate then usually swings to the nature of capitalist systems and that capital will flow to where it can be used most efficiently and to greatest effect (e.g. risk-adjusted return), and there it stops. Advocates for changing policy on climate will trot out the “if we don’t act we’ll all die and your money won’t mean anything” argument, having failed to learn that existential threats don’t tend to deter markets until they become existential realities, supporting a party-like-it’s-1999 mentality. However, one slide in the press packet which probably won’t get much attention actually holds the key to activating capital entitled “(In some cases) costs for renewables have fallen below those of fossil fuels.” This is profound in that it doesn’t require the rest of the science or policy or existential concerns to affect the flow of capital. It is simply becoming cheaper to convert today’s sunshine and wind into electricity and shove it into batteries than to dig up fossilized sunshine from more than 65 million years ago and burn it. Even with investment and innovation in efficiency, modern society will continue to be increasingly energy intensive, and as more of the world’s population joins the middle class, utilization will become even more widespread. Intelligent allocators of capital will pursue the cheaper inputs that will meet that demand.

WCM Chart of the Week for February 22, 2022

This week we get to take a break from talking about inflation to talk about… inflation. Although, in this case, what effects Russia’s moves on Ukraine might have. Russia’s economy is the 11th largest in the world as measured by nominal GDP, which seems significant until we realize it is smaller than Canada’s and 1/10 the size of China’s. Ukraine is 55th. Where Russia is most consequential in terms of their economy on the world stage is energy – petroleum and natural gas. Europe is a net importer of natural gas, a significant portion but not all of which comes from Russia. They have been increasing LNG imports from the US and Qatar, but that is mostly offset by a steady decline in domestic production. Natural gas is not the only major piece of the European energy portfolio, but it is material. Prices have already been high, and the decision to delay certifying Nord Stream 2 in response to Russian aggression means little relief is on the way. Globally, “OPEC+” has been falling short of targets to increase production post-COVID wind-down and the Ukraine conflict will not help climbing prices for oil either. The West is putting the framework for a new sanctions regime in place but that will mostly be about deciding who takes what share of the economic pain to box out Russia. Rising oil prices have similar effects on the economy as rising interest rates, so we are interested to see how the Fed digests the changing macroeconomic environment and the need to be aggressive on policy rates later in the year. Looking longer term, assuming the priority does not become preventing total war as Putin tries to reassert the borders of the former Soviet Union, we see this moment as a tipping point for Europe to accelerate their transition to a low-carbon future because it is an undeniable security imperative for the EU member states.  [Sources: US Energy Information Administration https://www.eia.gov/todayinenergy/detail.php?id=51258 and McWilliams, B., G. Sgaravatti, G. Zachmann (2021) ‘European natural gas imports’, Bruegel Datasets, first published 29 October, available at https://www.bruegel.org/publications/datasets/european-natural-gas-imports/]

Charting COP-26 — I know you are disappointed

“I know you are disappointed”. That was UN Secretary General Gutteres’ message to “young people, indigenous communities, women leaders, and all those leading the charge on climate action” as COP-26 adjourned in Glasgow. From the perspective of those four groups, representing rather a large percentage of the planet’s population, “disappointed” might be the diplomatic understatement of this century as they cling to the edge of an existential cliff. Can an institution that by design is meant to move (extremely) slowly and deliberately and with total consensus actually address something with this much urgency?

Perhaps the issue is one of framing. From the UN’s perspective, if they were presented with an international conflict where food systems were to collapse, millions of lives were to be at risk, millions were to become refugees, hundreds of billions of dollars of infrastructure were to be destroyed, and this catastrophe would know no borders and respect no nation, law, or military might, what would it do? Guns pointed at each other is actually one of many societal byproducts of climate change, but for this thought experiment we should focus on the magnitude of devastation and hardship that is happening without a shot being fired. If slowing things down is the UN’s true nature, what can it slow down to forestall the full impact of this emerging catastrophe while it finds a permanent fix? What resources would it mobilize?

197 nations are signing the “Glasgow Climate Pact”, but the two most populous countries insisted on a language change from “phase out” to “phase down” coal. That fundamentally changes the coal question from one of “when” to one of “if”. Again, looking at other activities that pose imminent threat to life and land that bring UN involvement, say, nuclear weapons development or massing troops on a national border, the distinction between “phase out” and “phase down” would be of monumental import. We are mired in process over outcome.

On the UN’s news feed for November 3rd, they reported “It’s ‘Finance Day’ at COP26, and the spotlight is on a big announcement: nearly 500 global financial services firms agreed on Wednesday to align $130 trillion – some 40 per cent of the world’s financial assets – with the climate goals set out in the Paris Agreement, including limiting global warming to 1.5 degrees Celsius.” At the UN above all other institutions, words mean something. What does “align” mean? Is this another “phase down” vs. “phase out” situation? For what we do on a regular basis as allocators of capital within that ecosystem of global financial services firms, we are forced to ask if this is a commitment to the largest greenwashing campaign in history. As we have written and spoken about repeatedly, we are looking to see whether this is the first step of many along a path to more sustainable capital allocation, or window dressing to manage optics. Intentionality is everything.

As noted previously, it is going to take the mobilization of private and not government capital to reach the intensity and scale of development necessary to forestall the worst effects of the climate crisis. Governments, who already failed to live up to their prior pledges to deploy $100 billion annually, should instead pivot to facilitating marketplaces and lowering barriers and allow the free market to do its work. Shifting capital to a regenerative model for food, energy, water, and infrastructure could unlock an economic boom and broaden participation in a way which would be historic in defining the 21st century.

Charting COP-26 and the Path to Zero, November 5, 2021

Yesterday a consortium of mostly Anglo and European countries signed a statement affirming a commitment to “deliver sustainable, green and inclusive economic growth to meet the challenge of decarbonising our economies, in line with limiting the global average temperature increase to 1.5°C above the preindustrial levels.” The statement covers six categories of targets — Support for workers in the transition to new jobs, social dialogue and stakeholder engagement, economic strategies, local, inclusive, and decent work, supply chains, and Paris Agreement reporting. The important thing we note in this statement is the recognition of the necessity of public/private partnership. The path to zero requires industry and market-wide activation of capital and corporate infrastructure in the private sector and regulatory and reporting frameworks from the public sector that facilitate the private sector’s work. This chart from a May 2021 International Energy Agency (IEA) report “Net Zero by 2050: A Roadmap for Global Energy Sector” provides an excellent overview of the business and industry targets that must be met with the facilitation and support of both governments and NGOs over the next 30 years. The signatories to the statement make sense in that these are many of the wealthiest industrialized nations that have both the capital to pursue this agenda and a high degree of responsibility for having brought us to the climate precipice. However, the lack of presence from Australia, China and Japan is concerning as they must help lead among the community of nations as the most developed and prosperous (polluting) countries of the Asia-Pacific region.

Charting COP-26, Take 2, November 3, 2021

Jair Bolsonaro isn’t there either. While the President of Brazil is not in attendance, the country is still represented, but one is forced to wonder what the degree of commitment is when the boss chooses not to attend for “strategic” reasons. On the positive side of the ledger, even with Bolsonaro’s absence Brazil signed on to the pledge between 100 signatory countries to end deforestation by 2030. And reinforcing our point about the real action being with private enterprise and not with government, dozens of global financial services companies also are committing to discontinue investment in and financing for businesses and other concerns engaging in or profiting from deforestation. Today’s charts look at the trends and patterns in Amazonian deforestation. Brazil made great positive strides over the past decade dramatically improving over the prior twenty years. However, with Bolsonaro’s election we observe a significant jump in activity in 2019, and expect similar increases in 2020 and 2021 (not yet reflected in the data). The second chart from NASA provides a visual representation of reduction in vegetation in the Amazon in a period between 2000 and 2008 to illustrate the patterns of destruction. Ironically, note that the pattern looks like leaf veins, propagating from main roads to local roads and spreading out into the forest until larger and larger tracts of land are cleared. Crops like soy account for much of the native vegetation cleared, and one of the biggest importers of Brazilian soy in the last couple years is China. No Bolsonaro. No Xi. Starting to see a pattern there too? 

WCM Chart of the Week for September 29, 2021

Natural gas prices around the globe are elevated, and as the colder winter months in the Northern Hemisphere approach, prices will likely remain so. An unfolding potential crisis is most acute in the Eurozone where natural gas futures prices have increased over 500% in the past year, and conditions in the rest of the world are not much better. Calmer weather in Europe and thus lower wind turbine energy production has been cited as one reason for elevated prices, and rising demand for natural gas as a lower-carbon transitional fuel away from coal and oil is another. Unchecked, the higher price environment may lead to blackouts, heating shortages in colder regions, and forced plant shutdowns, and may exacerbate current and broader inflationary trends. Also, higher utility prices are effectively a tax on consumers (hitting lower wage earners the hardest) hastening an end to the global economic recovery that may be already moderating or even stalling in some parts of the world.

WCM Chart of the Week for June 14, 2021

Consumers of lumber products may finally see an end to soaring prices. Lumber crack spreads (the difference in prices of finished lumber and raw timber) have been rapidly falling since peaking in early May. Specifically, the measure on this week’s chart uses the CME futures spot rate of random length softwood 2x4s used in construction minus the Timber Mart-South US Louisiana Pine Sawtimber spot rate. Both indices are falling with finished board prices falling at a faster pace.

There are a variety of reasons why finished lumber prices surged, ranging from a beetle infestation in western Canada and the US Pacific Northwest, strong pandemic-stimulated single family housing demand, glue shortages related to the storm-induced petrochemical plant shutdowns in Texas earlier in the year, and a lack of truckers and workers for sawmills. This confluence of events may be playing out in other industries and be part of why the Fed considers rising key consumer and producer prices transitory and not permanent. Nonetheless, inflationary concerns that recently unnerved the capital markets will likely continue to arise for some time to come. [chart courtesy Bloomberg LP © 2021]