Category: European Union (Page 1 of 2)

WCM Chart of the Week for February 22, 2022

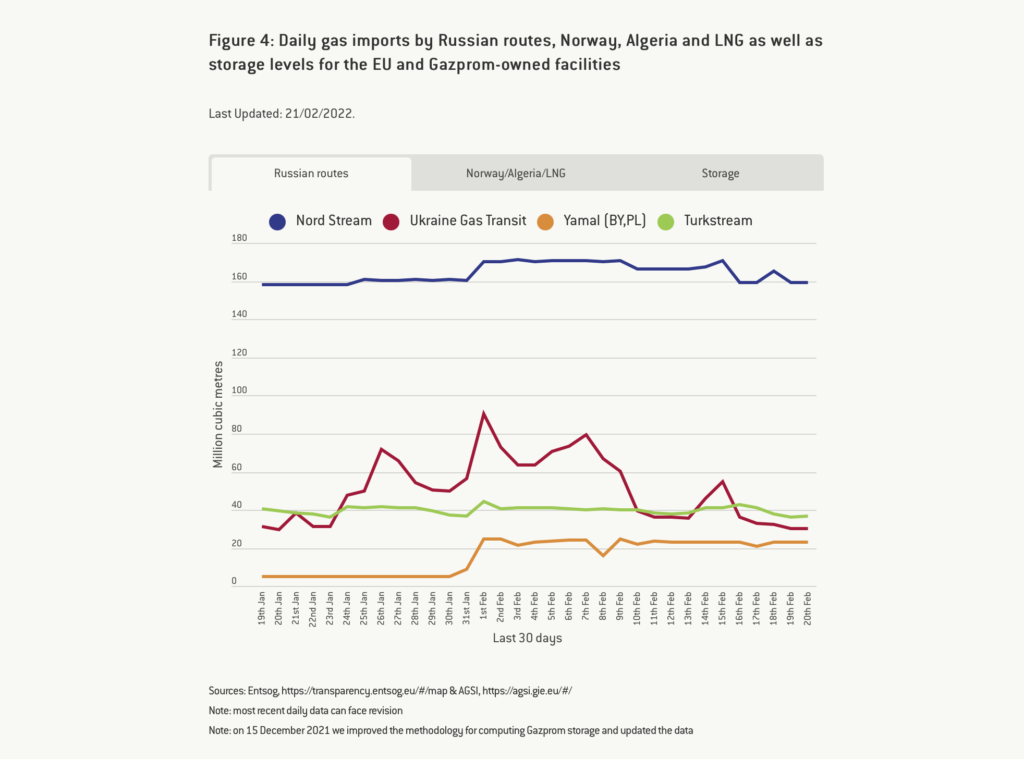
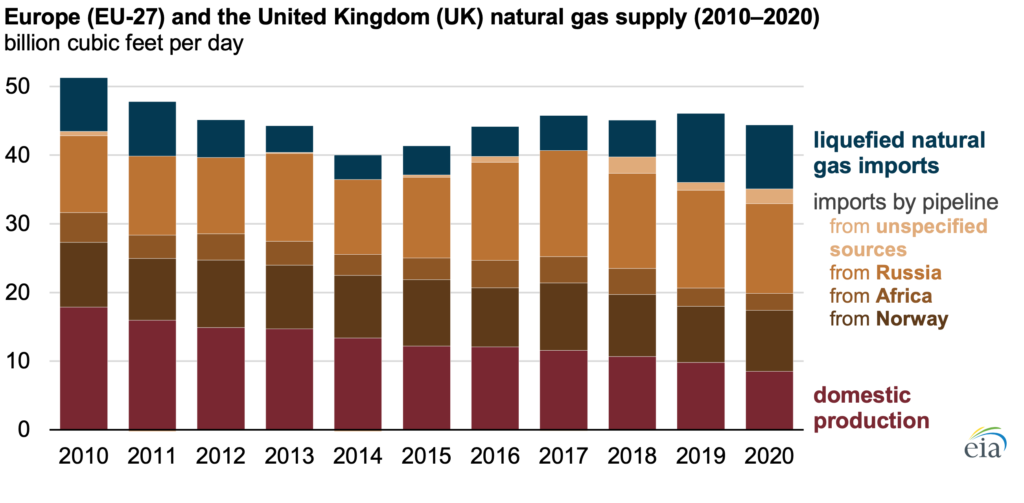
This week we get to take a break from talking about inflation to talk about… inflation. Although, in this case, what effects Russia’s moves on Ukraine might have. Russia’s economy is the 11th largest in the world as measured by nominal GDP, which seems significant until we realize it is smaller than Canada’s and 1/10 the size of China’s. Ukraine is 55th. Where Russia is most consequential in terms of their economy on the world stage is energy – petroleum and natural gas. Europe is a net importer of natural gas, a significant portion but not all of which comes from Russia. They have been increasing LNG imports from the US and Qatar, but that is mostly offset by a steady decline in domestic production. Natural gas is not the only major piece of the European energy portfolio, but it is material. Prices have already been high, and the decision to delay certifying Nord Stream 2 in response to Russian aggression means little relief is on the way. Globally, “OPEC+” has been falling short of targets to increase production post-COVID wind-down and the Ukraine conflict will not help climbing prices for oil either. The West is putting the framework for a new sanctions regime in place but that will mostly be about deciding who takes what share of the economic pain to box out Russia. Rising oil prices have similar effects on the economy as rising interest rates, so we are interested to see how the Fed digests the changing macroeconomic environment and the need to be aggressive on policy rates later in the year. Looking longer term, assuming the priority does not become preventing total war as Putin tries to reassert the borders of the former Soviet Union, we see this moment as a tipping point for Europe to accelerate their transition to a low-carbon future because it is an undeniable security imperative for the EU member states.  [Sources: US Energy Information Administration https://www.eia.gov/todayinenergy/detail.php?id=51258 and McWilliams, B., G. Sgaravatti, G. Zachmann (2021) ‘European natural gas imports’, Bruegel Datasets, first published 29 October, available at https://www.bruegel.org/publications/datasets/european-natural-gas-imports/]
Charting COP-26 and the Path to Zero, November 5, 2021

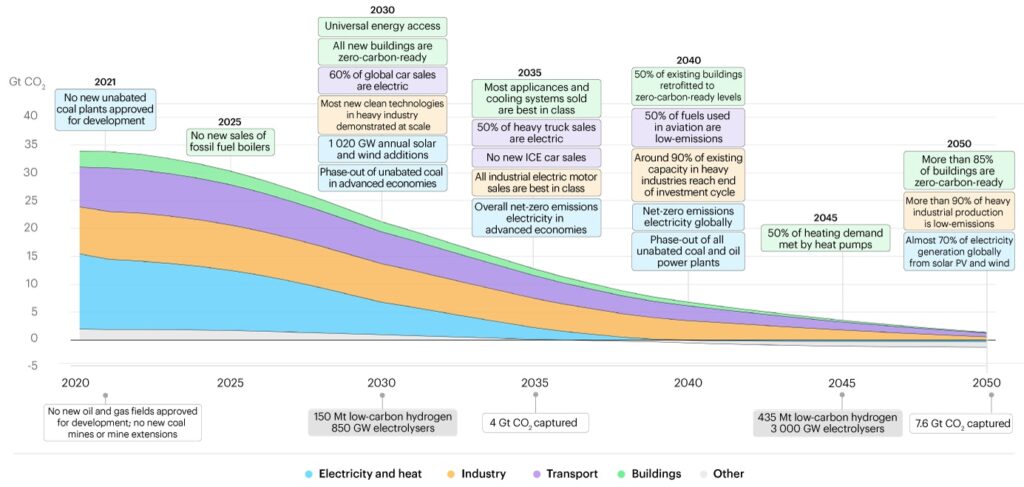
Yesterday a consortium of mostly Anglo and European countries signed a statement affirming a commitment to “deliver sustainable, green and inclusive economic growth to meet the challenge of decarbonising our economies, in line with limiting the global average temperature increase to 1.5°C above the preindustrial levels.” The statement covers six categories of targets — Support for workers in the transition to new jobs, social dialogue and stakeholder engagement, economic strategies, local, inclusive, and decent work, supply chains, and Paris Agreement reporting. The important thing we note in this statement is the recognition of the necessity of public/private partnership. The path to zero requires industry and market-wide activation of capital and corporate infrastructure in the private sector and regulatory and reporting frameworks from the public sector that facilitate the private sector’s work. This chart from a May 2021 International Energy Agency (IEA) report “Net Zero by 2050: A Roadmap for Global Energy Sector” provides an excellent overview of the business and industry targets that must be met with the facilitation and support of both governments and NGOs over the next 30 years. The signatories to the statement make sense in that these are many of the wealthiest industrialized nations that have both the capital to pursue this agenda and a high degree of responsibility for having brought us to the climate precipice. However, the lack of presence from Australia, China and Japan is concerning as they must help lead among the community of nations as the most developed and prosperous (polluting) countries of the Asia-Pacific region.

WCM Chart of the Week for September 29, 2021

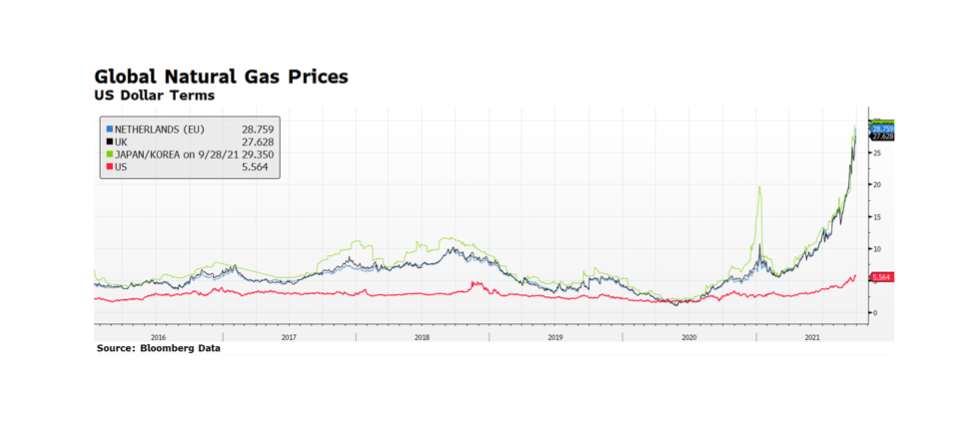
Natural gas prices around the globe are elevated, and as the colder winter months in the Northern Hemisphere approach, prices will likely remain so. An unfolding potential crisis is most acute in the Eurozone where natural gas futures prices have increased over 500% in the past year, and conditions in the rest of the world are not much better. Calmer weather in Europe and thus lower wind turbine energy production has been cited as one reason for elevated prices, and rising demand for natural gas as a lower-carbon transitional fuel away from coal and oil is another. Unchecked, the higher price environment may lead to blackouts, heating shortages in colder regions, and forced plant shutdowns, and may exacerbate current and broader inflationary trends. Also, higher utility prices are effectively a tax on consumers (hitting lower wage earners the hardest) hastening an end to the global economic recovery that may be already moderating or even stalling in some parts of the world.

WCM Chart of the Week for August 9, 2021

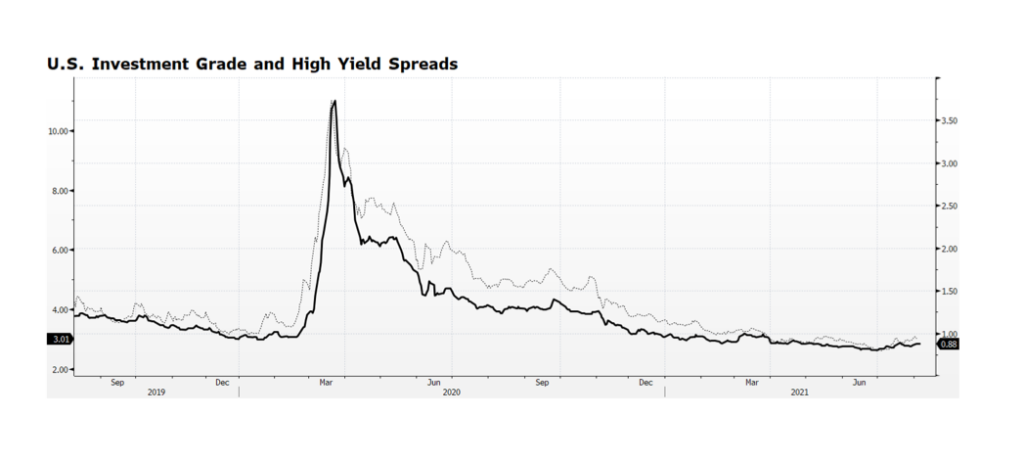
Investment Grade and High Yield bond spreads have been edging higher since reaching their tightest levels ever at the end of last quarter. Admittedly, the spread widening may have more to do with the decline in Treasury yields since June 30th than an indication of any deterioration in the credit markets. What is interesting to us is that this has been occurring while broad stock market indices in the US and Europe are hitting all-time highs. Equity market valuations are full, particularly in the US, but according to Bloomberg consensus earnings are expected to grow by 11.8% over the next 12 months, putting the forward PE ratio of the S&P 500 at 20.3x, lofty yet not extreme. Our sense is that, barring a major surprise or a misstep by the US Fed, the positive tone in equities in the Western world will continue. The outcome of the Fed’s September meeting will be highly scrutinized but the likelihood that they will surprise markets is low. [chart courtesy Bloomberg LP © 2021]

WCM Chart of the Week for May 25, 2021

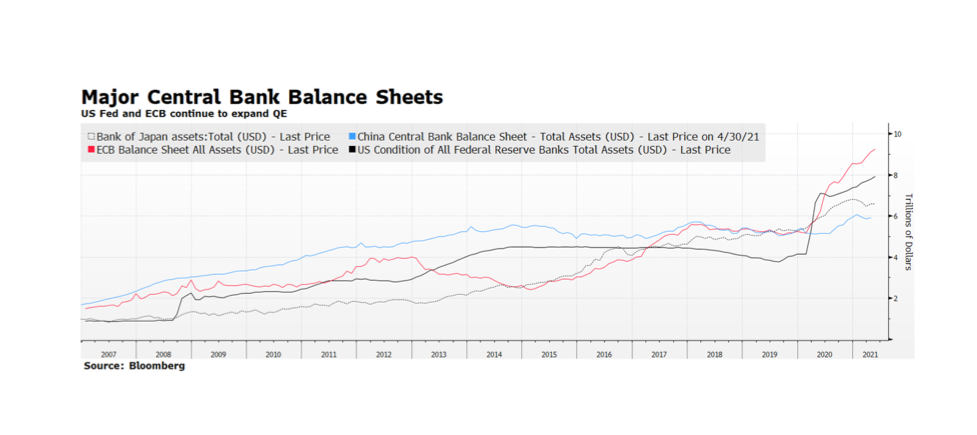
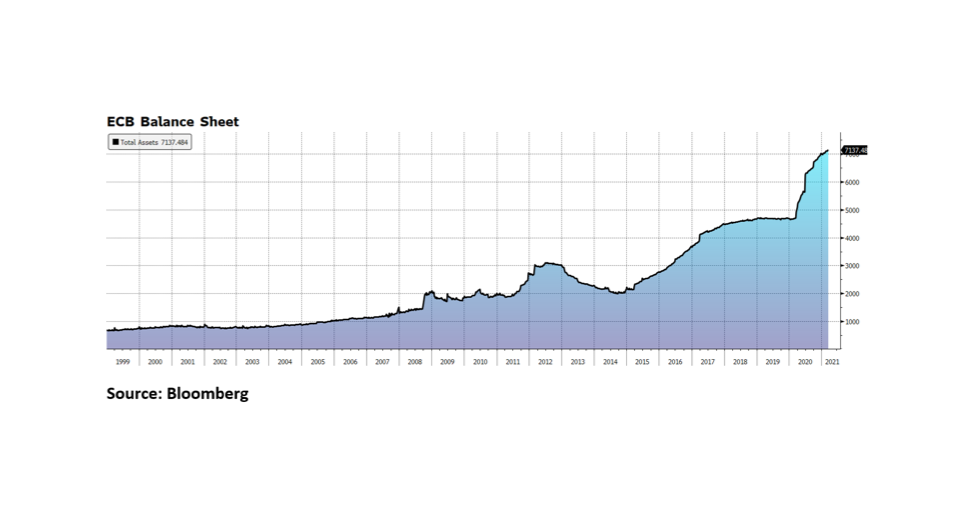
The US Fed and European Central Bank (ECB) continue to pursue aggressive quantitative easing while the two dominant Asian central banks, the Bank of Japan and the People’s Bank of China, have slowed their securities purchases so far this year. The ECB’s activity is of particular interest, not only because of the size of the balance sheet ($9.2T, €7.6T), but the pace that it has expanded over the course of the past year. The ECB’s monetary support continues at a critical time as the EU economy appears to be emerging from the pandemic-induced slump. Lock downs are slowly being lifted and infection rates are plunging from the March and April spikes. Another promising (gradual) trend emerging is in sovereign interest rates in the region, which appears to be an indication of stronger economic activity in the months ahead. [chart courtesy Bloomberg LP (c) 2021]

WCM Chart of the Week for April 12, 2021

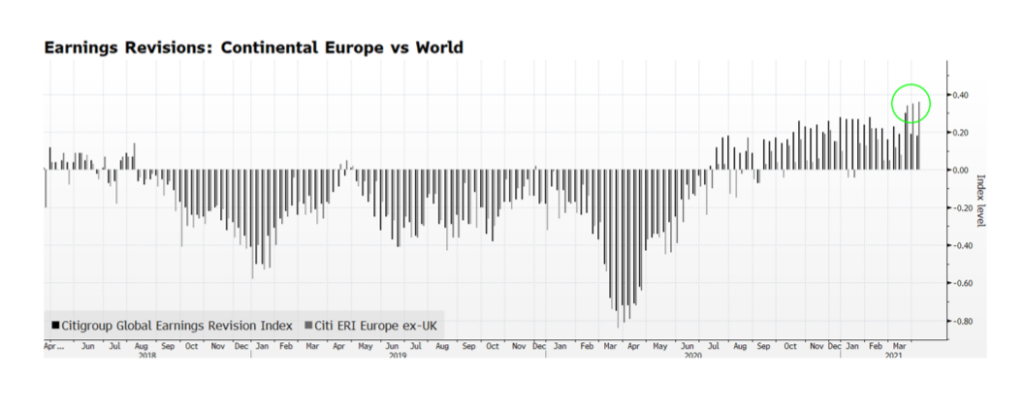
According to Citigroup’s Earnings Revision Indices, Eurozone earnings are far outpacing the rest of the world, and equity prices are gaining on a relative basis as well. Year-to-date through April 12th, Eurozone shares still trail the S&P 500 total return in US dollar terms 7.2% to 10.2%. Equity investors may be signaling that even in the midst of reimplemented economic shutdowns and virus spikes, the worst may be over on the Continent and more prosperous conditions are on the horizon. There are also reasons to be optimistic about the region’s stocks — they trade at favorable valuations compared to US equities and the ECB is continuing to be highly accommodative making fixed income alternatives unattractive. If Eurozone equities can continue to rally and broaden the global advance of stocks it would likely provide a boost of confidence for investors worldwide. [chart courtesy Bloomberg LP, Citigroup © 2021]

WCM Chart of the Week for March 22, 2021

The European Central Bank’s net purchase of bonds through March 19th surpassed 21 billion Euros, the most since December, in an attempt to halt the rise in continental bond yields. According to Bloomberg, the yield on the Generic 10-year Euro Government Bond has risen from -0.67% in mid-December last year to -0.3% currently. Granted, Euro yields from 2-to-10 year issues are still negative but the pace of escalation has many concerned given the economic headwinds caused by the pandemic and the recent resurgence of infections and “re”closings. ECB President Christine Lagarde arguably faces a tougher challenge than her central bank counterparts because the EU does not have the fiscal flexibility of other major economies. That constraint may turn out to be a blessing for them as the US, for instance, implements yet another round of fiscal stimulus amounting to $1.9 trillion while the economy across the pond shows signs of accelerated economic activity.

WCM Chart of the Week for December 21, 2020

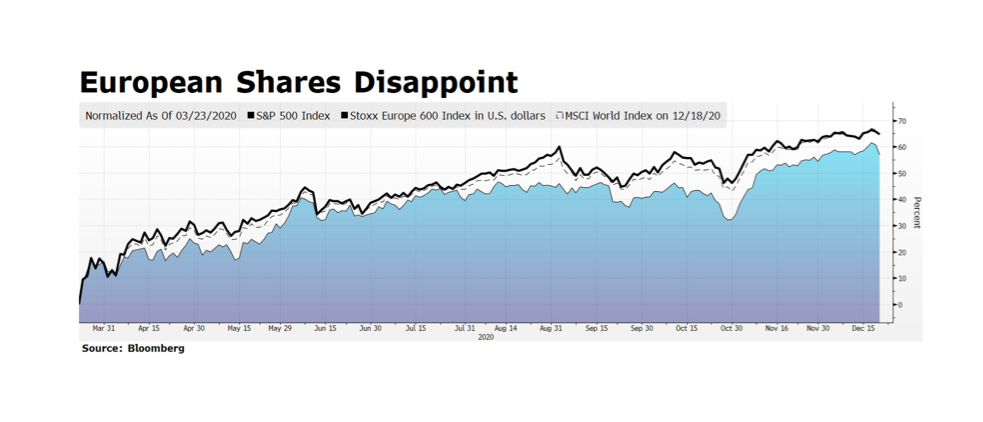
European equities have been rallying yet continue to lag the US and the rest of the world. Since global equities found their pandemic-induced bottom on March 23rd, both the S&P 500 and the MSCI World Indices have rallied over 65% as of last week’s closing levels (12/18/2020) while European shares have climbed just over 60% measured in US dollar terms. While a 60% recovery in approximately three quarters is impressive, it is masked due to currency movement over the period. The Eurostoxx 600 itself has climbed 44% in local currency terms from March 23rd through Friday’s close, and the Euro has rallied over 17% since March 23rd. The disparity in performance suggests a few things to us. First, European investors may have less confidence in their stock markets due to a lack of forceful coordinated continental response to the pandemic. Second, the currency tailwinds for European shares reflect more of a “retreat” from the pandemic flight-to-safe-haven currencies like the Dollar than true economic resiliency. Finally, we are particularly mindful that other stock markets beyond Europe may offer superior growth prospects, which would be especially attractive in a low-growth developed West.

WCM Chart of the Week for October 26, 2020

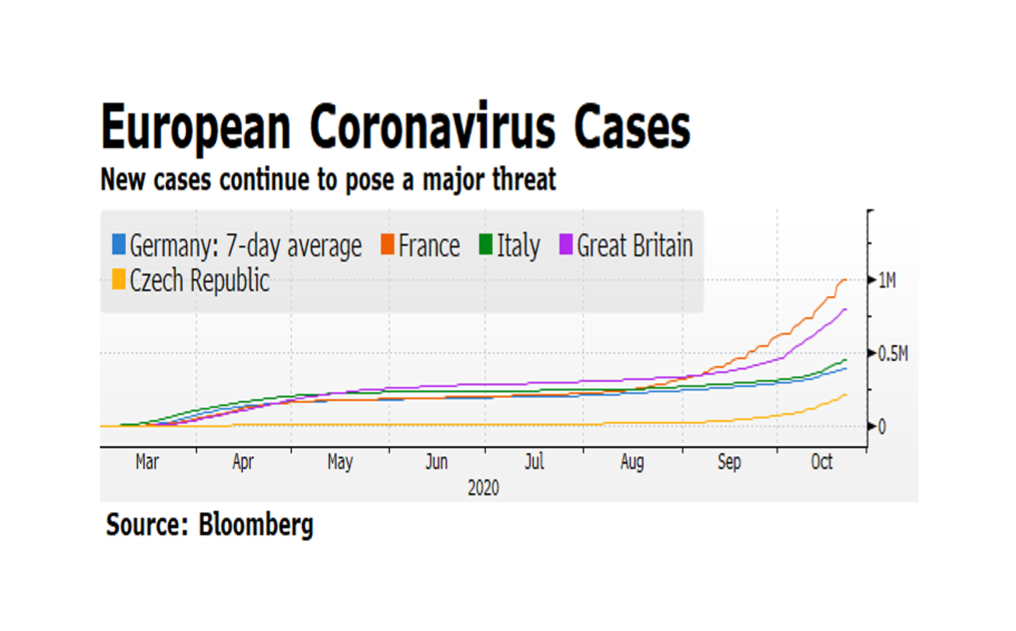
Over the past decade or more, Europe has endured several painful crises spanning Euro-related stresses to the recent Brexit uncertainty.  The common thread retarding recoveries from these epochal events has been the lack of coordinated policy response, in particular fiscal stimulus. The European Union, now with the UK removed, simply does not have the strength to influence its member states to expand fiscal spending that would benefit the region beyond each country’s own national borders. Now the global Coronavirus pandemic is accelerating to frightening levels across Europe as evidenced by case momentum. The imprint on European stock prices is telling.  From the onset of the pandemic, the broad-based EuroStoxx 600 is over 8% lower in US dollar terms and has been range trading since early June. By contrast, The S&P 500 is flirting with all-time highs. We believe the difference is that, while Europe has generally been more aggressive in the public health response to the pandemic, the overwhelming US fiscal and monetary response carries the day as compared to the apparent EU policy vacuum.

WCM Chart of the Week for July 31, 2020

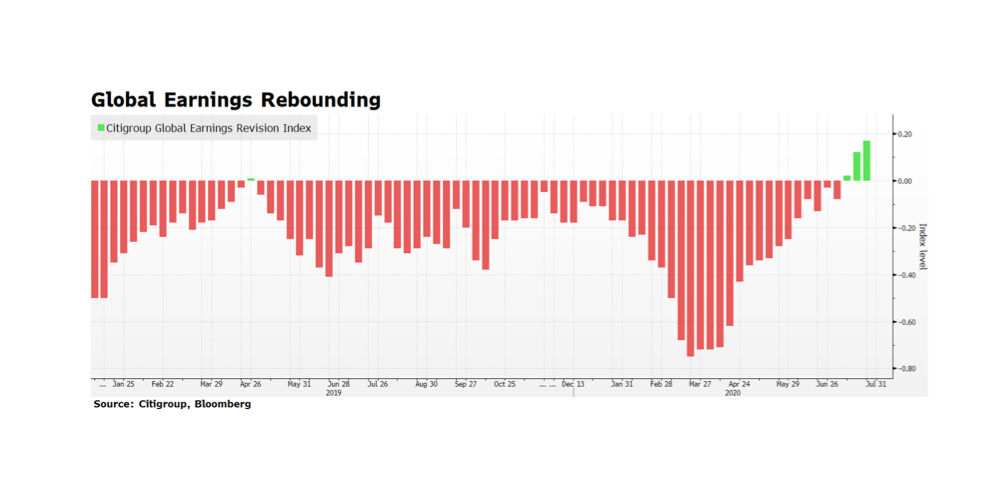
Over the past few weeks, corporate earnings across the globe have been showing signs of recovery.  Citigroup’s Global Earnings Revision Index has been climbing for three weeks in a row, encouraging given the economic challenges facing the world.  While this trend is positive, its path will be unpredictable due to COVID-19 related shut down and re-openings in several key economies. The recovery in corporate earnings, if it persists, could alleviate the tragic stress in labor markets and help reinvigorate economic activity heading into 2021. Fiscal support is building momentum with the European Union’s 750 billion Euro stimulus plan (discussed last week) and the anticipated fourth phase of US stimulus.  It does remain to be seen if the enormous amount of spending, both fiscal and monetary, will have a lasting impact.

« Older posts