Category: Chart of the Week (Page 16 of 18)

WCM Chart of the Week for Oct. 24, 2018

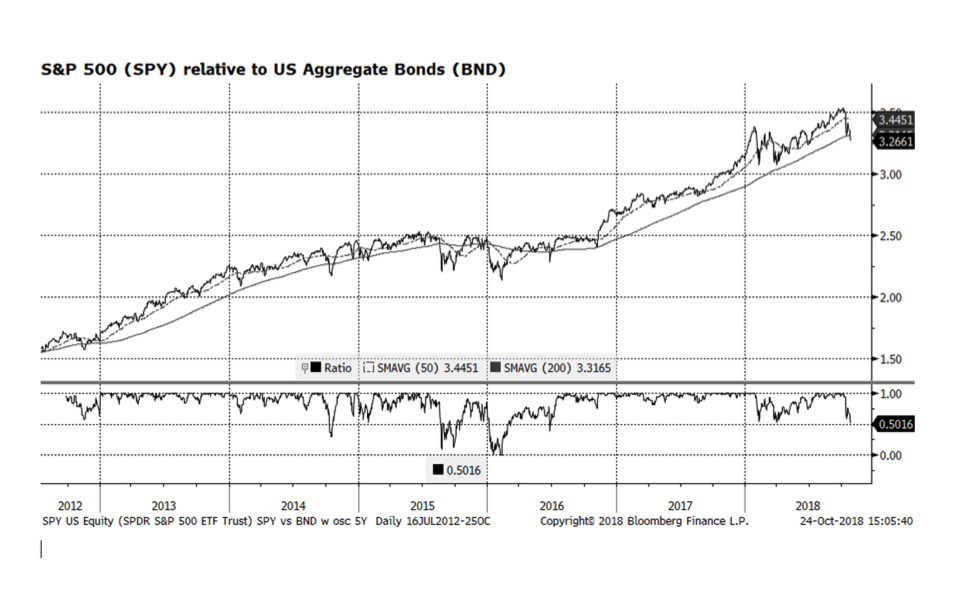
The first investment decision for many asset allocators – the US equity-vs.-fixed income relationship – has broken a key long-term trend and support level. The ratio of the S&P 500 and US Aggregate indices (we use ETFs as proxies because we can obtain real time intraday measures) has fallen below it’s 200-day moving average, which is making US stock prices vulnerable. The last time this occurred was in mid-2016 before stocks began their recent run of dominance. As we have been discussing for the past several months, economic conditions and US corporate fundamentals remain strong and are markedly different than the tug of war we experienced prior to the stock breakout that occurred in mid-2016. In our view, the market is adjusting to the mix of higher US interest rates and slowing economic growth in key regions. We are in the midst of US corporate earnings season with some key companies lowering earnings and revenue guidance, putting downward pressure on those stocks. We believe that the current market adjustment is healthy and we will see higher US equity levels as we head towards the end of the year.

WCM Chart of the Week for October 17, 2018

Stock markets around the globe continue to be highly volatile as key indices have sharply corrected since the beginning of October. By earlier this week, the S&P 500 had declined 5.6%, the Eurostoxx 600 had fallen 6.4%, the Nikkei contracted 6.3% and the MSCI Emerging Markets index had shed an additional 7.3% through the close on October 15th. As earnings season progresses, we are seeing positive results from major US financial institutions which are welcomed signs. Bigger picture, analyst expectations for future earnings and sales growth into 2019 and beyond (this week’s chart and admittedly an extension of last week’s) signal further expansion. The risk may be to the upside as strong US economic trends could propel sales and earnings above expectations. However, there are considerable risks at home with upcoming national elections and upward interest rate trends as well as challenging economic conditions in several key international regions.

WCM Chart of the Week for Oct. 10, 2018

International stock markets have been weak for several quarters measured in US dollar terms and it appears that may be affecting the US stock market. As of tonight’s (October 10th) close the S&P 500 has contracted 4.9% from its all time high reached on September 20 with most damage occurring in the past six days of trading. Today alone accounted for 94 points of the 144 point decline in the S&P price level. While the pain has been deep and swift as the market adjusts to a higher interest rate environment, economic trends remain supportive of further earnings, revenue and market gains. This week’s chart shows analyst expectations for S&P 500 earnings and sales levels, and it does not appear that the upward advance is rolling over or stagnating. That could change as earnings season arrives but, for the time being we view this sell-off as a bull market consolidation.

If you enjoy the COTW, don’t forget to follow us on Instagram [@wildecapitalmanagement2016], Facebook [@wildecapitalmgmt], and LinkedIn.

WCM Chart of the Week for September 5, 2018

The JP Morgan Emerging Market Currency Volatility Index remains elevated as concerns about currency stability appear to be spreading among several of the world’s developing nations. The currency rout that began in Argentina, moved on to Turkey due to the country’s double-digit inflation and sizeable current account deficit, has spread to Indonesia and now South Africa. Investors fear that the contagion will spread further throughout the developing world. The fundamental economic backdrop is not uniform across emerging markets – Asia is generally exhibiting admirable growth trends – yet in the near term, negative momentum may overtake fundamentals.

WCM Chart of the Week for August 21, 2018

We recently reduced our position in Eurozone equities, which brings our overall exposure to Europe further underweight. One area within European equities that we are quite concerned about is the bank sector. The Italian debt situation is at the heart of the matter as interest rate spreads between Italian and German bonds have been widening. The rising risk premium demanded by investors is one indication of concern regarding the scale of the new Italian governing coalition’s fiscal plans. The deteriorating value of Italian debt impairs bank balance sheets across the region and in turn pushes European bank share prices lower (depicted on the chart below). The interdependence of European banks and government debt has been problematic for some time and measures are being taken by regulators to address this relationship.

WCM Chart of the Week for August 15, 2018

Volatility in the world’s emerging economies has spiked, in our view related to Turkey’s building economic and currency crisis. We continue to avoid direct exposure to Turkish equities and emerging market debt overall but are concerned that the crisis could spread to other countries in the region. One concern of ours is the European banking sector which is already struggling with Italian debt exposure. So far this week some stability has returned to the Turkish Lira as the government announced relaxed standards for troubled loan restructuring. But, ultimately interest rates will likely have to be raised to support the currency.

WCM Chart of the Week for August 8, 2018

JPMorgan’s CEO Jamie Dimon, arguably the world’s most influential banker in decades, is known for making headlines.  This week he commented that investors need to get ready for interest rates on the benchmark US 10-year treasury approaching 5%.  Many reacted with skepticism given current yields hovering around 3%, but robust economic conditions in America should push interest rates to more normal levels.  Prior to the crisis, yields on benchmark government bonds in the US and Europe were hovering near Dimon’s stated range, consistent with long-term nominal economic trends.  We do not take issue with his comments; we only suggest that they be considered in a global context. Interest rate differentials in the western world that were fairly tight prior to the crisis have diverged over the course of the past five years or so.  We have believed for some time now that rates in the US will be tethered lower due to anemic economic conditions in the rest of the developed world.  Is this a longer-term or near-permanent investment condition with respect to the Eurozone?  Japan has had to deal with low yields, sluggish economic growth and persistent deflationary pressures for years.  Europe is more diverse and arguably more dynamic than Japan but… #moreofthesame #Fed #lowrates #yield #lostdecades

WCM Chart of the Week for July 25, 2018

Consumer Discretionary stocks have outperformed the S&P 500 for nearly a year and appear to be peaking. Valuations of the sector are stretched as compared to historical averages and the overall market. That has a lot to do with two of the sector’s largest constituents, Amazon and Netflix, both of which have been expensive for several years but are key players in the increasingly technology-driven new economy. We have an active allocation to the sector and we pay close attention to how it and its key names are faring fundamentally and performance-wise. The case can be made for further outperformance as the overall economy and the consumer strengthens.

WCM Chart of the Week for July 18, 2018

US equity markets have been driven by the technology sector over the past several years as investors allocated to this key area of the US and increasingly global economy. For some time, technology stocks have delivered superior growth characteristics that normally could be sought in US Small Cap equities or the world’s emerging markets. Current valuation readings in technology are stretched as compared to the overall market and their own longer-term averages. The key going forward is whether the dominant technology companies, often referred to as the FAANG* stocks, can continue to deliver strong earnings this season as well as in coming quarters. A concern to many – including us – is that the rally in large cap stocks has become increasingly narrow and dependent on these companies. However, market leadership appears to be rotating into US Small Caps which could drive equities going forward.
*Facebook (FB), Apple (APPL), Amazon (AMZN), NetFlix (NFLX) and Alphabet – widely known as Google (GOOG/GOOGL)

WCM Chart of the Week for June 27, 2018

We have been intrigued over the past several months by total return trends in US bond markets. It has been a rough first half of the year for bonds so far with the Bloomberg Barclays US Aggregate Total Return index contracting 1.95% year-to-date through June 22, 2018. What is interesting to us is prices have fallen to a greater degree in US investment grade corporate bonds as measured by the iBoxx Very Liquid index, (-4.78%) as compared to with the Bloomberg Barclays US Treasury Index (-1.43%). This has occurred while US corporate fundamentals are quite strong.

What concerns us is that interest rate spreads (depicted in the chart) between US investment grade corporate credit and US Treasuries have climbed from levels we last experienced during the pre-crisis era. This could just be a pause and spreads resume their tightening path that began several years ago, ultimately approaching lows reached in 2007. Or we could see further widening that could signal economic and market deterioration. There are many dynamics at play – central bank activity across the globe is a major factor – and this is one simple measure, yet we believe it is a critical one.

« Older posts Newer posts »