Category: Chart of the Week (Page 11 of 18)

WCM Yule Chart for 2019

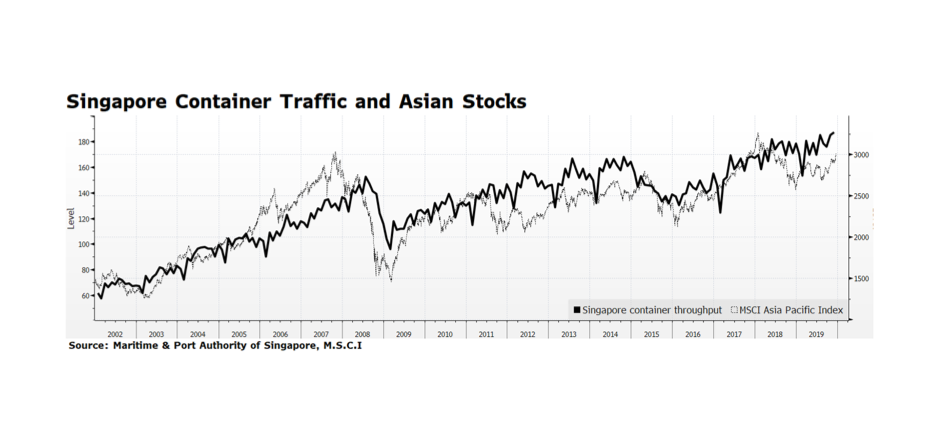
Nothing says holiday cheer like Asian exports. Actually, come to think of it that probably says a lot about holiday cheer depending on what is under your tree, menorah, or Festivus pole. Equities in Asia have been rallying since early this Fall but have underperformed global peers this year. But, on a positive note, container traffic in Singapore just hit an all-time high, which should be supportive of Asia’s bourses going forward. The reason container traffic is important is because it is a barometer of trade momentum in the region and Singapore is a strategic transfer point for goods. Its exports hover around 200% of GDP.  Trade flows should continue to improve with Phase 1 of the US – China trade agreement and US House of Representatives passage of the US Mexico Canada Agreement (passage in the US Senate is likely).  These developments are critical considering global economic activity is moderating. [chart courtesy Bloomberg LP © 2019 and Maritime & Port Authority of Singapore, MSCI]

WCM Chart of the Week for December 13, 2019

Boris Johnson’s Conservative Party triumphed in Parliamentary elections on December 12th, gaining 48 seats, which gives the party a clear majority in the House of Commons.  Support was surprisingly strong in Northern England and Wales which have been historically been Labour Party strongholds.  The outcome all but makes Brexit a certainty and Johnson has indicated that he will accelerate legislation through parliament to meet the January 31 target date for leaving the EU.  The Great British Pound (pictured below) as well as the UK stock market rallied strongly, likely in anticipation of the electoral outcome.  British assets have been trading at significantly lower valuations than comparable global assets and this may be a catalyst that brings values more in line.  In our view, there still is uncertainty regarding potential disruption in supply chains and labor markets as the Brexit process unfolds.  There is, however, more clarity regarding this tense situation. [chart courtesy Bloomberg LP © 2019]

WCM Chart of the Week for December 6, 2019

This morning the Labor Department announced that payrolls expanded by 266,000 in November, well ahead of estimates.  Just as important, the previous month’s jobs were revised upwards to 156,000 and the unemployment rate matched the 50-year record low of 3.5%.  Average hourly wages also expanded 3.1% signaling that consumers’ wallets are gaining on the overall economy.  Hiring momentum is no doubt strong and is outpacing growth in the labor force.  While this is good for employees currently, continued wage inflation may cut into future corporate profits.  The low inflation environment may make it difficult for companies to raise prices as wage pressures may crowd out margins. [chart courtesy Bloomberg LP (c) 2019]

WCM Chart of the Week for November 25, 2019

Christine Lagarde has taken the helm at the European Central Bank from the highly regarded yet somewhat controversial Mario Draghi at the beginning of November.  While many view Draghi’s leadership as forcing the ECB to the limits of monetary policy, he was successful in maintaining the monetary union and the single currency at several critical points in time over the past decade.  Lagarde faces a formidable challenge inheriting a central bank that is divided in the direction of policy. Her legacy as a consensus builder may prove invaluable at this pivotal point in time.  In her debut speech last week, she emphasized the need for stronger domestic demand and fiscal policy in order to counter the evolving global trade balance.  If she is successful in convincing countries with budget surpluses to spend and invest through fiscal stimulus, the region may see stronger economic activity and a firmer Euro which has been in a downtrend versus the US Dollar since the financial crisis.  The world needs a stronger, more resilient Europe and we believe Christine Lagarde will be an ideal leader of the ECB. [chart courtesy Bloomberg LP © 2019]

WCM Chart of the Week for November 15, 2019

Large Cap stocks in the United States have outperformed the rest of the world for the better part of the past ten years largely because of superior demographic, economic and corporate conditions in America.  However, there have been several periods this decade when international bourses have gained ground on America and that has been the case since mid-August this year.  While US companies have tended to exhibit robust fundamentals compared to their international rivals, stock market valuations favor international equities. Can the rest of the world continue to outpace the US?  We continue to favor American stocks and bonds because economic conditions abroad continue to be challenging.  Eurozone economic activity is barely expanding, although the German economy did surprise on the positive side (thus narrowly avoiding a recession) and Chinese GDP growth may be slowing more than expected.  The headwinds international markets face may prove to be too much to overcome from a relative performance standpoint. [chart courtesy Bloomberg LP (c) 2019]

WCM Chart of the Week for November 8, 2019

The global rally in stocks and key US equity indices hitting all-time highs are again garnering the majority of the financial press’ collective attention. We however prefer to focus on government bond markets. Long-term interest rates may have bottomed towards the end of this past summer. 10-year government bond yields in key developed economies are on the upswing and may even have positive readings in Japan and the Eurozone before year end. We find the upward interest rate trajectory interesting in the context of the US Federal Reserve’s recent decision to lower its target rate. It is encouraging that yields are rising together which may be a signal that economic conditions across the globe are stabilizing and safe haven asset prices are falling. [chart courtesy Bloomberg LP © 2019]

WCM Chart of the Week for November 1, 2019

Growth stocks in the US have outperformed value stocks for the better part of the past three years with the exception of the US Fed induced sell off at the end of last year. However, since mid-August value stocks have outpaced growth stocks by a considerable amount rallying nearly 8% versus 3.5% according to S&P 500 Value and Growth indices.  If value stocks can continue to outperform or even keep pace with the overall market, we would view this as a positive development because it could mean that broader participation is developing.  That is important because the S&P 500’s largest the sector, Information Technology, continues to outperform, powering the market higher.  We find this interesting because usually technology stocks outperform with growth leading value. [chart courtesy Bloomberg LP © 2019]

WCM Chart of the Week for October 18, 2019

Chinese officials announced year-on-year 6% GDP growth for the third quarter, which was slightly below consensus estimates of 6.1%. The main drag on the economy was slowing investment growth while factory output rose along with retail sales. Tightening credit conditions are also contributing to the moderation in growth as officials continue to address excesses in the financial system. The on again/off again US trade negotiations continue to be a source of uncertainty. The government’s target of 6-6.5% growth for 2020 is at odds with market forecasts. The International Monetary Fund (IMF) is expecting Chinese GDP to fall below 6% to 5.8% in 2020 and continue to moderate in subsequent years, slowing to 5.5% in 2024. In the near term, Chinese officials have ample fiscal and monetary flexibility to manage the economy. However, in the long run, the adverse impact of the one child policy will cause demographic trends to deteriorate rapidly. The National Bureau of Statistics previously announced that births dropped to 15.2 million in 2018, representing a 12% annual decline following a decline in 2017. Some see China’s population beginning to shrink as early as 2027 and others argue that it had already begun in 2018. A rapidly aging population will place strain on social services and likely constrain China’s fiscal flexibility in years to come.

WCM Chart of the Week for Oct. 11, 2019

Volatility in US Treasury prices has been building for the past six months or so as measured by the ICE Bank of America Merrill Lynch Move Index. That is not all that surprising given the magnifying effect even small interest rate movements have on Treasury prices in today’s low rate environment.  The challenge investors face is that bonds, particularly longer-dated issues, offer anemic income streams and the likelihood of principal erosion as rates rise to more normal levels.  We continue to maintain lower duration within fixed income allocations than our benchmark because we believe that the long end of the yield curve, here and abroad, offers little investment merit and the potential for a great deal of volatility.

WCM Chart of the Week for October 4, 2019

A 1.5 degree Celsius rise in global mean surface temperature over pre-1900 levels is considered to be a critical threshold above which environmental systems start to break down and serious and durable damage from climate change to the world around us really takes hold. 2 degrees is recognized as a tipping point where the damage is both catastrophic and irreversible, at least in terms of human timelines. This week’s chart is from the Intergovernmental Panel on Climate Change (IPCC) and shows us where we have been, and a possible range of temperature outcomes 80 years out, if we reduce anthropogenic (human-caused) CO2 emissions to zero over various time horizons. Even the best case projections, assuming aggressive and immediate emissions reductions, have us only leveling off around 1 degree over 1900, more or less where we find ourselves today. From a capital markets point of view this tells us two things – first, a best case means a continuation of much of what we have been experiencing with extreme climate events and therefore climate resiliency must be factored into risk assessments and securities pricing for equities, real estate, infrastructure, natural resources and bonds in the public and private sectors. Second, if we don’t turn the corner, the system will run away from us, mitigation will no longer be an option and asset prices will be jeopardized globally. Even being motivated solely by profit and loss this challenge is existential to the capital markets and must be addressed.

« Older posts Newer posts »