Author: WCM (Page 7 of 9)

WCM Chart of the Week for May 22, 2018

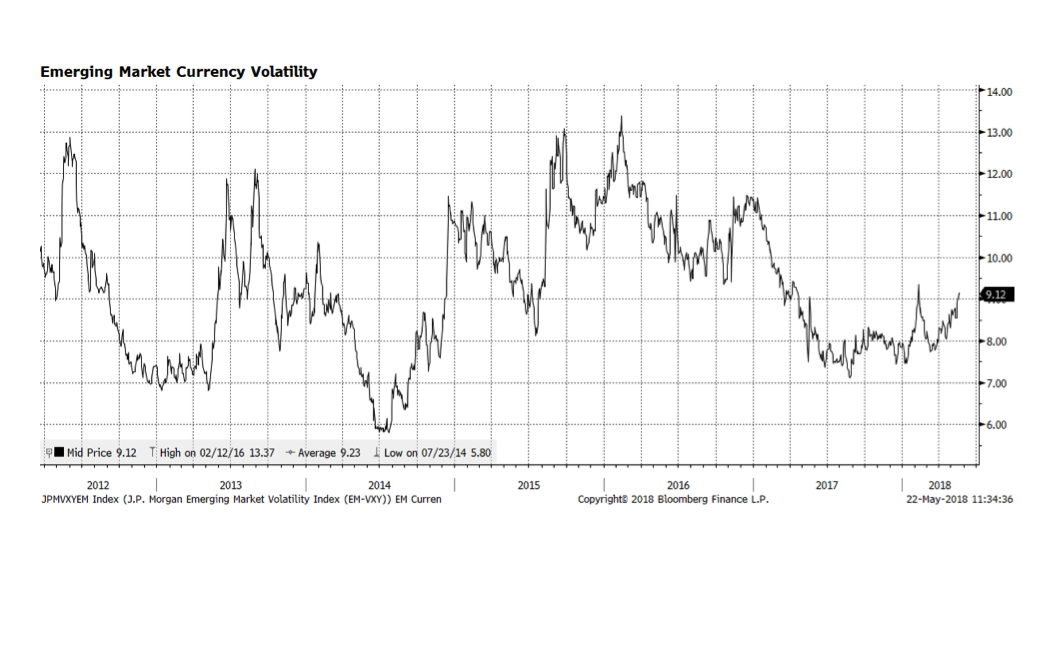
Several currencies in developing economies have been weakening against the US dollar and not surprisingly, volatility, depicted on the chart below, has been rising. Part of the fallout is related to US dollar strength against the Euro, Japanese Yen and British Pound but rising interest rates in the US are also a significant influence. External dollar-denominated debt issued by emerging economies in recent years has risen and repayment could be challenging if the dollar continues to strengthen. This warrants monitoring. We continue to have no emerging market debt exposure at this time.

WCM Chart of the Week for May 16, 2018

The yield on the widely followed benchmark 10 Year US Treasury bond eclipsed 3.05% Tuesday morning May 15th and now stands at levels last seen in 2011. The rise in April’s retail sales report showing further expansion likely helped push rates higher. Stronger economic activity and the potential for inflation are forces potentially putting upward pressure on interest rates, but record Treasury bond issuance is also a highly influential factor in the other direction.

We believe interest rates will continue to rise as the US Federal Reserve pursues monetary policy normalization and the economy expands. As a result, our fixed income positions remain short duration. Bloomberg’s survey of 58 analysts projects the yield on the 10 Year US Treasury bond should reach 3.19% by the end of 2018 which would imply further price declines in longer duration fixed income.

WCM Chart of the Week for May 8, 2018

Last week’s unemployment figures released by the US Bureau of Labor Statistics were further signs that the labor market as well as the overall economy continue to improve. Headline unemployment is at the lowest level since the technology boom fueled 1999-2000 period. Unemployment including part time workers is approaching levels experienced during that same timeframe. While this is good news for the American worker, the market is concerned that labor scarcity could place upward pressure on wages, inflation and ultimately interest rates. Right now, nominal wage inflation is contained at 2.6%, a level the Federal Reserve has indicated to be tolerable.

WCM Chart of the Week for May 2, 2018

US Dollar strength caught some investors off guard recently as Bloomberg’s DXY index, which measures the dollar versus a basket of major currencies, has risen some 3% over the past three months. Dollar strength could persist if interest rates continue to rise in the US as monetary policy continues to firm, as many including us expect. Meanwhile, central bankers abroad, notably the ECB and BOJ, will likely remain more accommodative given weaker economic conditions—ECB President Draghi indicated as much last week in his post-ECB meeting remarks. The result could be further widening of interest rate spreads across government bond markets.

The strength/weakness of the US dollar represented by DXY, the red line on the chart below, appears to be related to Global government bond spreads among US Treasuries, U.K. Gilts, ECB Bonds and JGBs. Spreads contracted from 2006 until the financial crisis during a period of dollar weakness. The dollar rebounded in the aftermath of the crisis, and over the past decade of extraordinary central bank intervention, the relationship between global spread differentials and the value of the dollar appears to be influential.

WCM Chart of the Week for April 18, 2018

John Williams, current head of the Federal Reserve’s San Francisco branch, will soon be taking over as head of the influential New York branch. He was recently discussing a range of topics including the flattening of the US yield curve, which measures the spread between shorter and longer-term US Treasury rates. The risk is that as the yield curve inverts – when short term rates rise above long term rates – a recession usually follows (represented as shaded areas spanning back three decades).

It appears that we may have some time before the curve inverts, if it does at all. Every cycle is different and this one is unique due to the absolute low level of rates throughout the world. Interest rates in Europe and Japan may anchor US rates lower than they otherwise would be. That, in turn, may distort the shape of the curve in coming quarters and with it change the economic impact.

WCM Chart of the Week for April 11, 2018

Investors have been focused on gyrations in the US equity market and rightfully so. It has been quite harrowing to witness the large intraday price swings in the major US indexes as market participants react or sometimes overreact to tariff and trade-related posturing among the Trump administration and trading partners. Our sense is that the market is attempting to establish a new equilibrium once a new global export/import balance is established. A new global balance of trade may not be bad for the world as long as the outcome is truly fairer and freer trade, but still, the uncertainty around this issue has caused painful volatility.

Meanwhile, the US bond market as measured by the Bloomberg Barclays US Aggregate Index depicted below, has offered a relative safe haven at least since mid-February. However, the index is about 1.5% lower year-to-date. We are concerned about rising interest rates in the US and the impact on bond prices and potentially the stock market. In the bond portion of our portfolios we have allocated to investments that are shorter duration and tend to perform better in rising interest rate environments. On the equity side of the equation we have more exposure to less rate sensitive sectors. We view the interest rate environment as a major risk and we believe that the US Federal Reserve will continue to be highly transparent and deliberate as it raises policy rates. Another anchor to interest rates in the US is accommodative central bank policy in the Eurozone and Japan where comparable interest rates are expected to remain low for longer.

WCM Chart of the Week for April 3, 2018

There has been an increased level of volatility in US equities across several key larger capitalization indexes going back to the first week of February. Lately, investors have been attempting to identify what may lead to a market bottom and many have been drawing attention to S&P 500 price levels relative to its 200-day moving average — a key long-term trend measure. On April 2nd the S&P 500 price index closed below the 200-day moving average for the first time since late June 2016. Today, the index recovered and closed slightly above that trend line. The question for investors is whether the correction will deepen or did yesterday mark the resumption of the bull market.

On a total return basis (which we find more relevant as that is what people actually get by investing), the S&P 500 has yet to close below the 200-day moving average. That is critical in our view, although we do acknowledge that this measure is precariously close to turning negative. What appears to be escalating trade friction between the US and China among other trading partners, potentially developing into a much broader trade war, is the most likely reason US equities have entered a corrective phase. The market is now trading at valuations last seen in 2016 which could be a bargain since fundamentals in the US remain strong and earnings are expected to be robust in coming quarters.

WCM Chart of the Week for March 22, 2018

Larry Kudlow was appointed by President Trump as Director of the National Economic Council, replacing the widely respected Gary Cohn. Kudlow, a former Federal Reserve and Wall Street economist and most recently a television host on financial news network CNBC, has raised some eyebrows with his comments regarding his support for a strong dollar. The dollar has been in a downward trend against a basket of major currencies since the beginning of 2017, although it has strengthened modestly over the past month or so. Weakness may have been more related to economic repair or the regaining of lost ground for the rest of the world versus the US. We view that as positive for the global economy and not necessarily a bad thing for the US. Corporate US fundamentals – most notably earnings growth – are robust and should support securities prices going forward. But, a stronger dollar could place downward pressure on earnings and serve as a headwind.

WCM Chart of the Week for March 13, 2018

Every cycle is a bit unique, but usually small- and mid-size companies underperform in the late stages of market cycles and ultimately contract more than their large-cap counterparts as markets correct. There is much concern that this cycle is in an advanced state and a consolidation or correction phase is upon us. What we find interesting is that small cap US stocks are rebounding and approaching all-time highs. We view this as an important development if the trend continues, especially with the heightened volatility of late. We also note that it appears that small- and mid-cap stocks have contracted less over the past week or so than large-caps on days when the major indices are negative. If these key segments of the stock market can surpass levels reached earlier in the year, that would mark obvious positive milestones and could lead the overall market higher still. Fundamentals dominate our analysis, but these technical factors are worthy of our attention as well.

WCM Chart of the Week for March 5, 2018

Equities in the Eurozone have had difficulty keeping pace with their global peers. There have been many encouraging signs on the economic front within the common currency zone, stock market valuation measures remain attractive compared to peers, and the interest rate outlook remains stable, yet regional shares continue to lag. One reason may be that consensus earnings expectations were inflated and are now being adjusted lower. (Chart courtesy of and copyright Bloomberg Finance LP 2018)

Remember to follow us on LinkedIn, Facebook and Instagram to get our Chart of the Week and other timely content delivered directly to your smartphone.

« Older posts Newer posts »