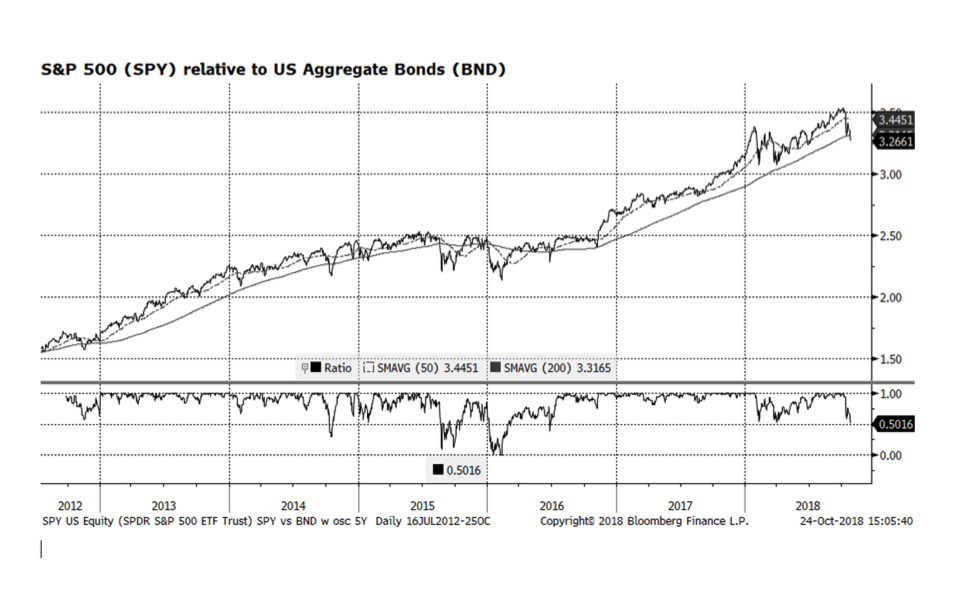
The first investment decision for many asset allocators – the US equity-vs.-fixed income relationship – has broken a key long-term trend and support level. The ratio of the S&P 500 and US Aggregate indices (we use ETFs as proxies because we can obtain real time intraday measures) has fallen below it’s 200-day moving average, which is making US stock prices vulnerable. The last time this occurred was in mid-2016 before stocks began their recent run of dominance. As we have been discussing for the past several months, economic conditions and US corporate fundamentals remain strong and are markedly different than the tug of war we experienced prior to the stock breakout that occurred in mid-2016. In our view, the market is adjusting to the mix of higher US interest rates and slowing economic growth in key regions. We are in the midst of US corporate earnings season with some key companies lowering earnings and revenue guidance, putting downward pressure on those stocks. We believe that the current market adjustment is healthy and we will see higher US equity levels as we head towards the end of the year.
Author: WCM (Page 5 of 9)
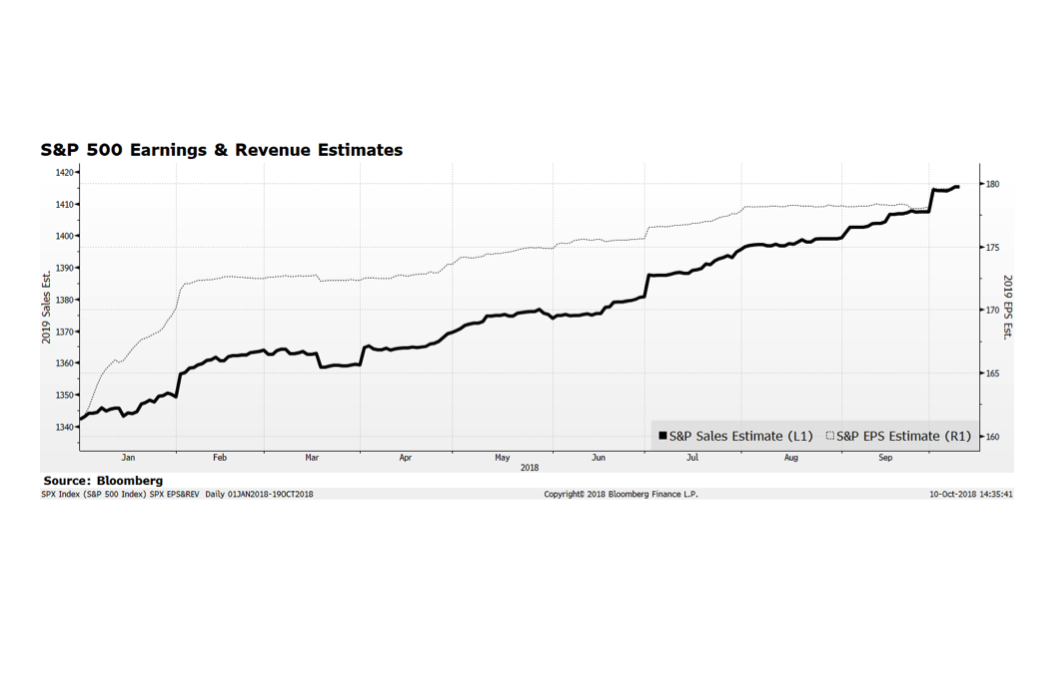
Stock markets around the globe continue to be highly volatile as key indices have sharply corrected since the beginning of October. By earlier this week, the S&P 500 had declined 5.6%, the Eurostoxx 600 had fallen 6.4%, the Nikkei contracted 6.3% and the MSCI Emerging Markets index had shed an additional 7.3% through the close on October 15th. As earnings season progresses, we are seeing positive results from major US financial institutions which are welcomed signs. Bigger picture, analyst expectations for future earnings and sales growth into 2019 and beyond (this week’s chart and admittedly an extension of last week’s) signal further expansion. The risk may be to the upside as strong US economic trends could propel sales and earnings above expectations. However, there are considerable risks at home with upcoming national elections and upward interest rate trends as well as challenging economic conditions in several key international regions.
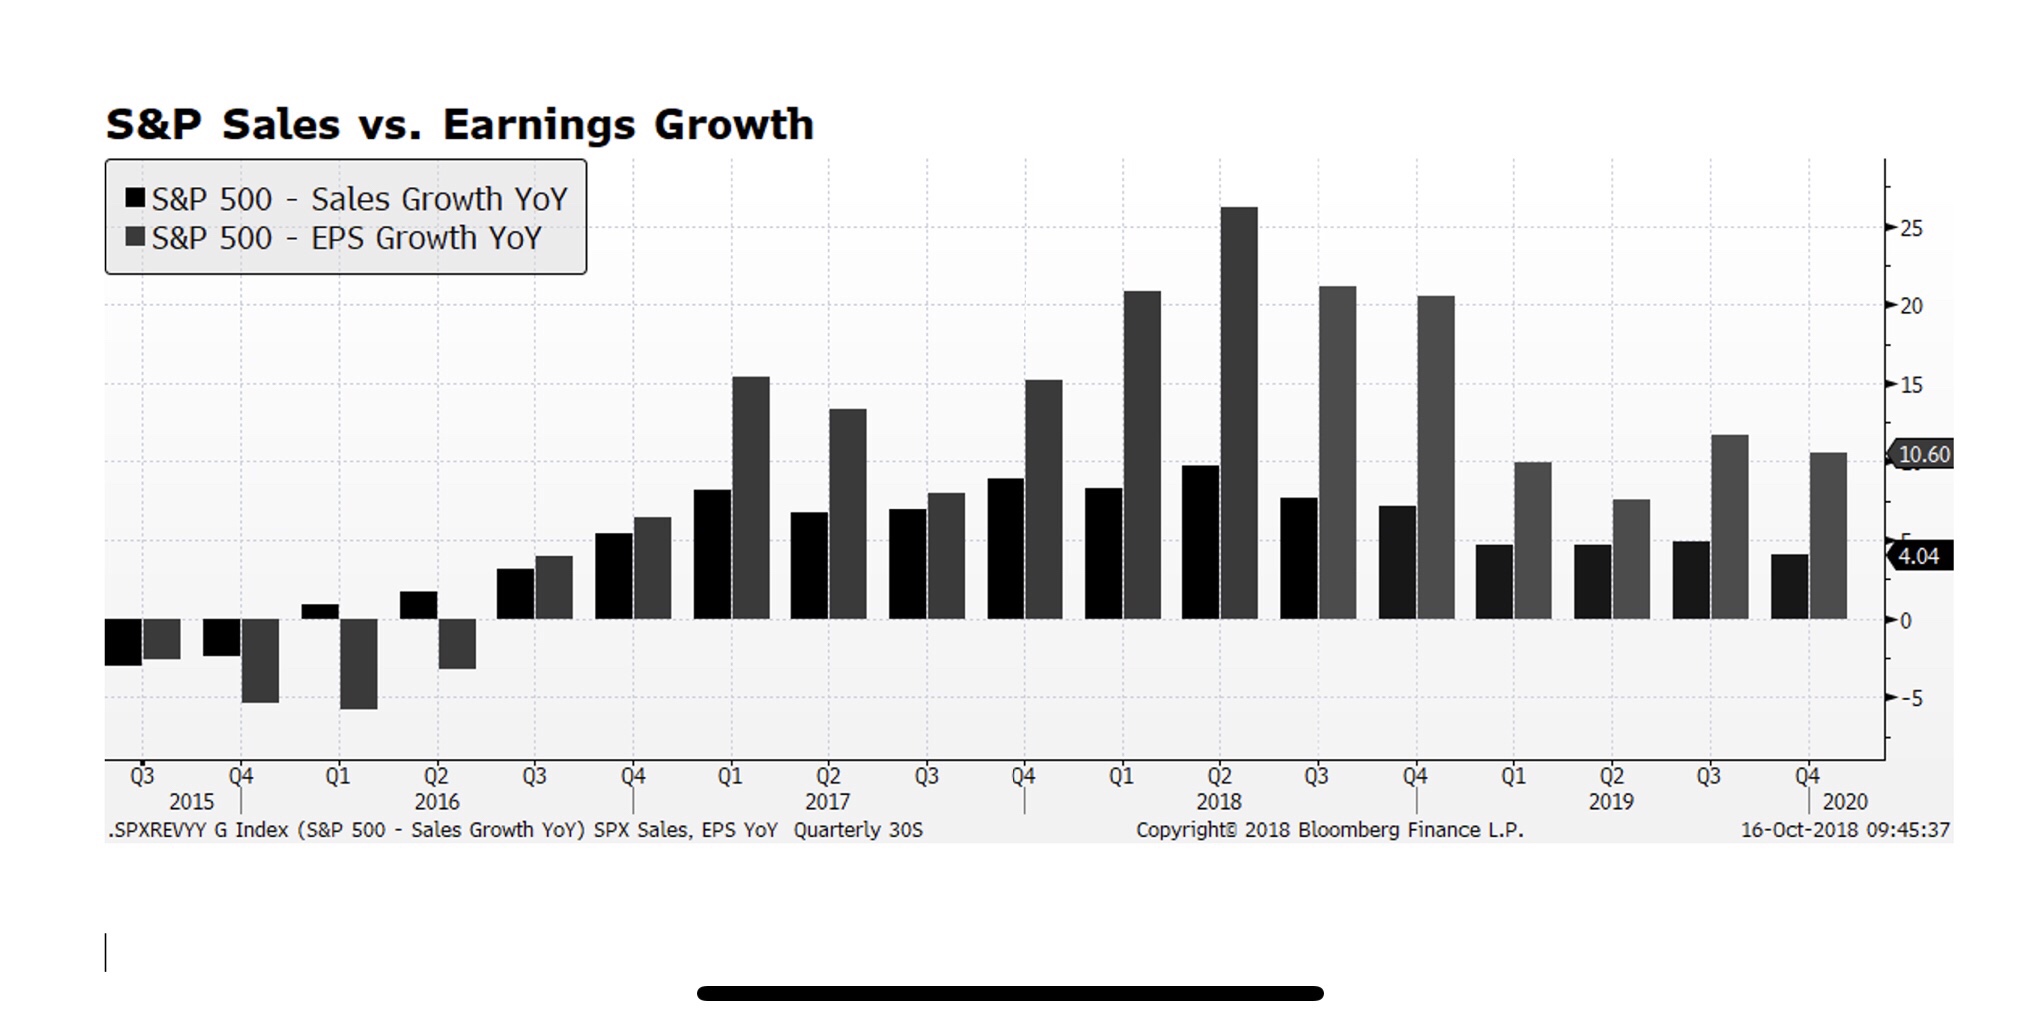
International stock markets have been weak for several quarters measured in US dollar terms and it appears that may be affecting the US stock market. As of tonight’s (October 10th) close the S&P 500 has contracted 4.9% from its all time high reached on September 20 with most damage occurring in the past six days of trading. Today alone accounted for 94 points of the 144 point decline in the S&P price level. While the pain has been deep and swift as the market adjusts to a higher interest rate environment, economic trends remain supportive of further earnings, revenue and market gains. This week’s chart shows analyst expectations for S&P 500 earnings and sales levels, and it does not appear that the upward advance is rolling over or stagnating. That could change as earnings season arrives but, for the time being we view this sell-off as a bull market consolidation.
If you enjoy the COTW, don’t forget to follow us on Instagram [@wildecapitalmanagement2016], Facebook [@wildecapitalmgmt], and LinkedIn.
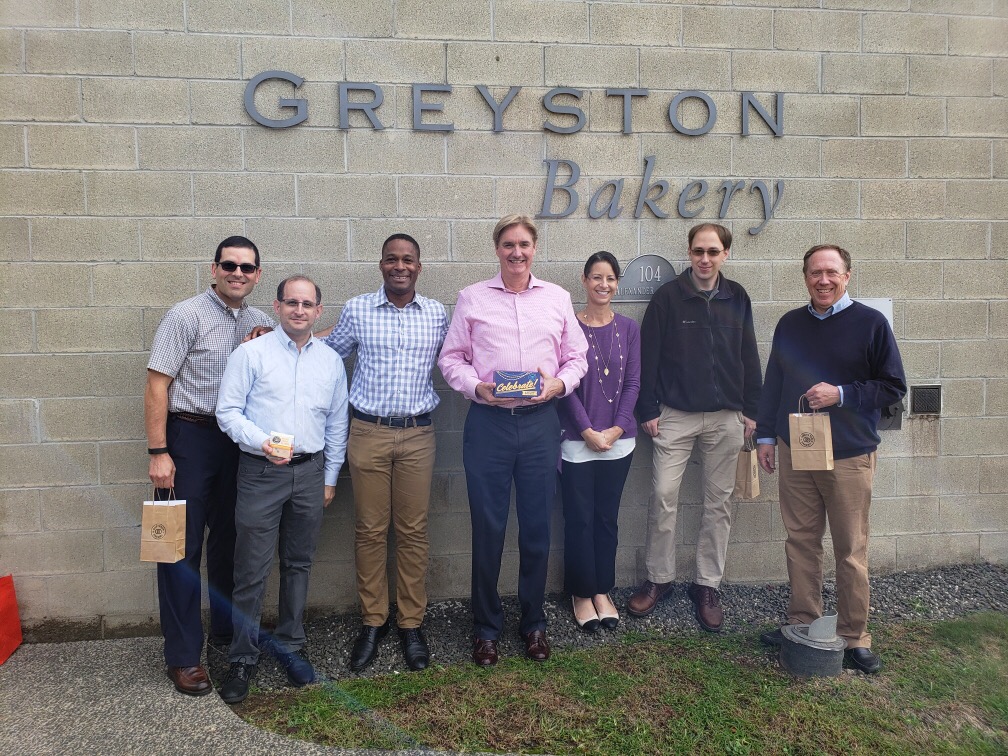
Profoundly grateful for and inspired by the time and insight the team at Greyston Bakery (@greystonbakery) in Yonkers, NY shared with us. Aside from turning out great brownies under their artisanal label as well as for Ben & Jerry’s, they lead the way in how they think about human capital and the means to staff a very loyal and effective work force and also create tangible social change through economic empowerment. Through their open hiring process, anybody can come apply for a job, and the application is little more than name, address, phone number, email address and what interests you. No pre-qualifications, no background checks, no work histories. Just ready to learn and to work. Even better, they assist their workers with the challenges that face many people in many companies, from childcare and transportation issues to alcohol and drug dependence challenges. They truly embody sustainable business in all parts of the value chain from fair trade suppliers to truly engaged personnel recruitment and management. Check them out at greyston.org, or in a pint of B&J’s Chocolate Fudge Brownie. The best way to conduct ESG research on a company’s supply chain! Special thanks to Joseph Kenner for hosting, and our friends at Conscious Capital Wealth Management for making arrangements.
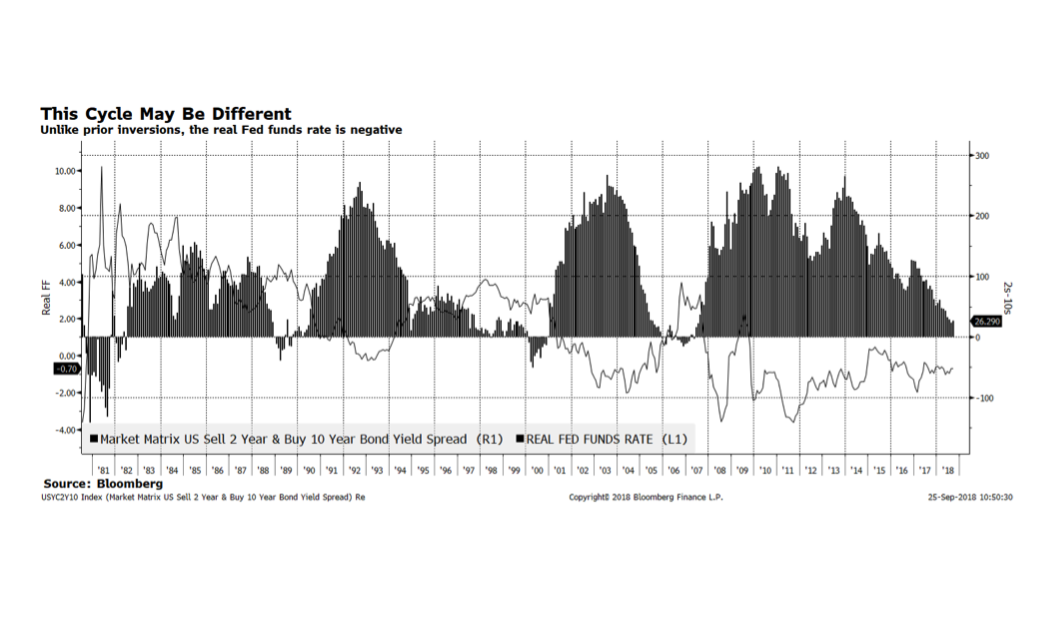
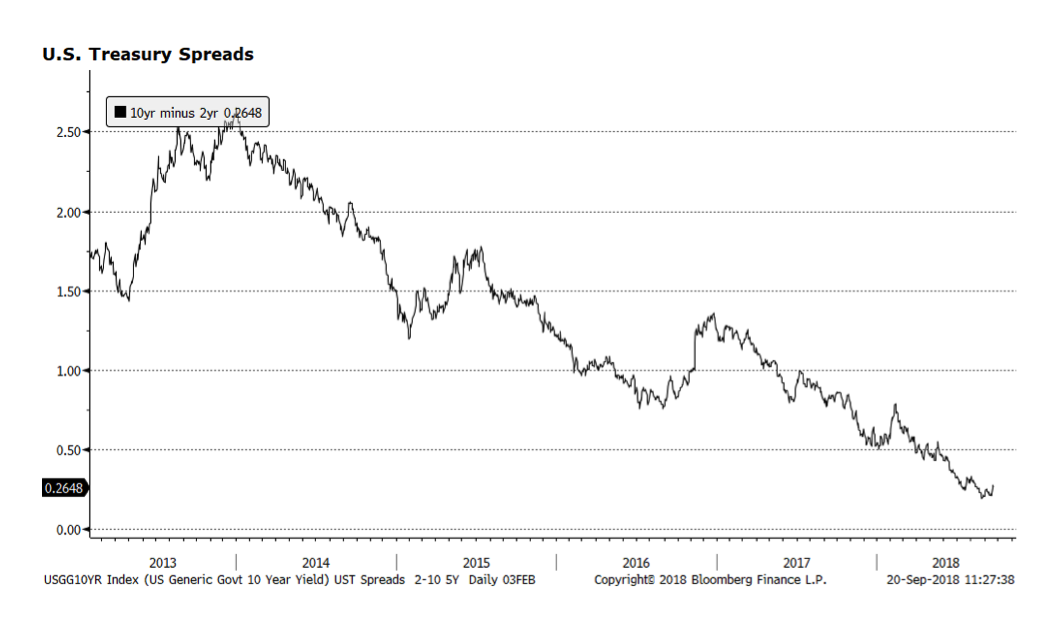
A little late with this week’s chart, but the last couple days have been critical in making this point — With interest rate spreads reaching levels that investors have not witnessed since the pre-crisis era, and in the case of Europe all-time wide measures, some wonder if this may be a precursor to an imminent market event. This cycle may be different. The US Federal Reserve will likely remain highly transparent as they reach what they consider to be neutral policy rates several quarters out. The wild card could be the ECB, and their interest rate trajectory and QE management in what we view as a fragile economic environment. Our sense is that central banks will tread very carefully as they manage policy rates upward, keeping in mind the precarious global economic state. The risk, from our perspective, is that further out, extensive monetary policy may create another adverse market event.
Interest rates have been of paramount concern for investors for several years given extremely low, and in some cases negative, levels in much of the developed world. The yield on the 10-year US Treasury has recently pierced the 3% level and now stands at 3.1%. The US Federal Reserve is poised to raise the upper band of the fed funds rate another 25 basis points to 2.25% on September 26 and many Fed watchers expect the central bank to continue raising rates until at least June 2019. Market participants are concerned that Fed activity will ultimately lead to an inversion of the yield curve and when that has occurred in past cycles, recessions often have followed. What is different this cycle is that the real federal funds rate is negative due to the Fed’s highly accommodative policy stance and, as shown in this week’s chart, have only experienced a yield curve inversion when the real fed funds rate is in positive territory.
There are many other factors that may influence this relationship and a considerable force, in our opinion, is central bank policy and the direction of interest rates in the rest of the world. In August, the Bank of England raised their policy rate to the highest level since the financial crisis and the European Central Bank may begin to raise borrowing costs by the end of this year.
The yield on the US Treasury bond, currently 3.06%, has pushed through the 3% level for the fourth time since the beginning of the year. We view this as a positive development and further confirmation that economic trends in the US continue to improve. The state of the US economy and corporate America is arguably more robust than at any point in the post crisis era. Our concern is whether risk assets can sustain materially higher interest rates and, so far, US stocks have proven resilient while the rest of the world has struggled, particularly the emerging markets. 
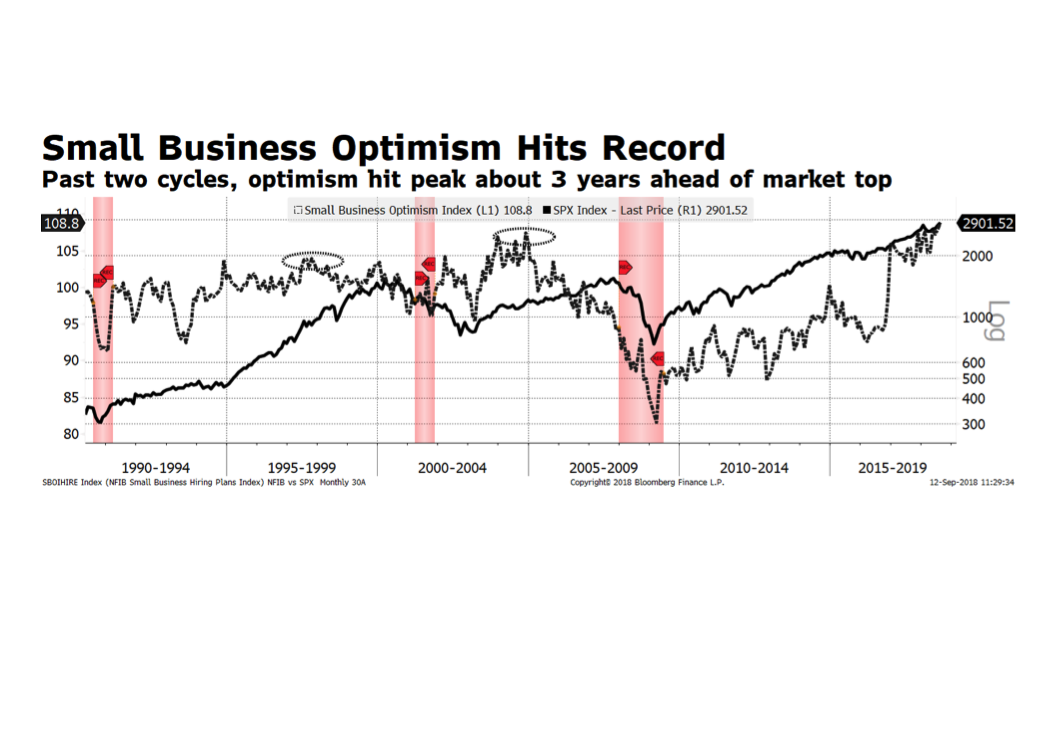
Our chart of the week comes courtesy of Bloomberg. The National Federation of Independent Business released its US Small Business survey this morning and the sentiment index reached 108.8, the highest reading in its 45 year history, even surpassing the previous peak reached in September, 1983. Other highlights in the report include: 1) capital spending plans are the highest since 2007; 2) inventory investment is the strongest since 2005; and 3) a record 26% of business owners plan to expand hiring. As the chart below shows, strong sentiment has been supportive of further gains in US stocks and in some cases for several years. But then, as sentiment wanes, equity prices weaken.
The JP Morgan Emerging Market Currency Volatility Index remains elevated as concerns about currency stability appear to be spreading among several of the world’s developing nations. The currency rout that began in Argentina, moved on to Turkey due to the country’s double-digit inflation and sizeable current account deficit, has spread to Indonesia and now South Africa. Investors fear that the contagion will spread further throughout the developing world. The fundamental economic backdrop is not uniform across emerging markets – Asia is generally exhibiting admirable growth trends – yet in the near term, negative momentum may overtake fundamentals. 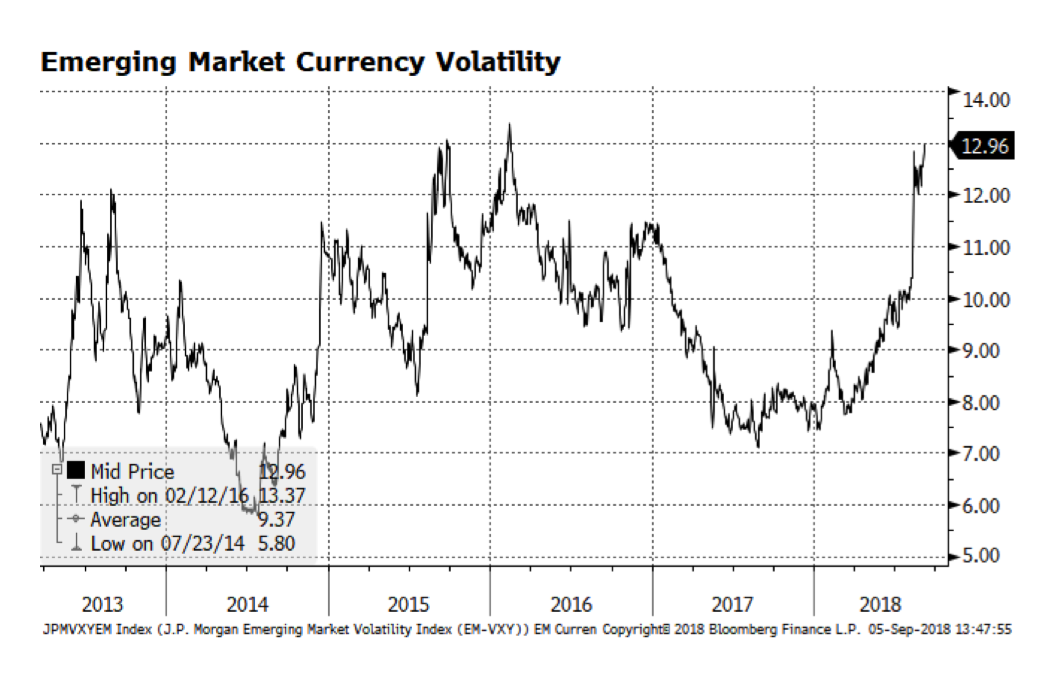
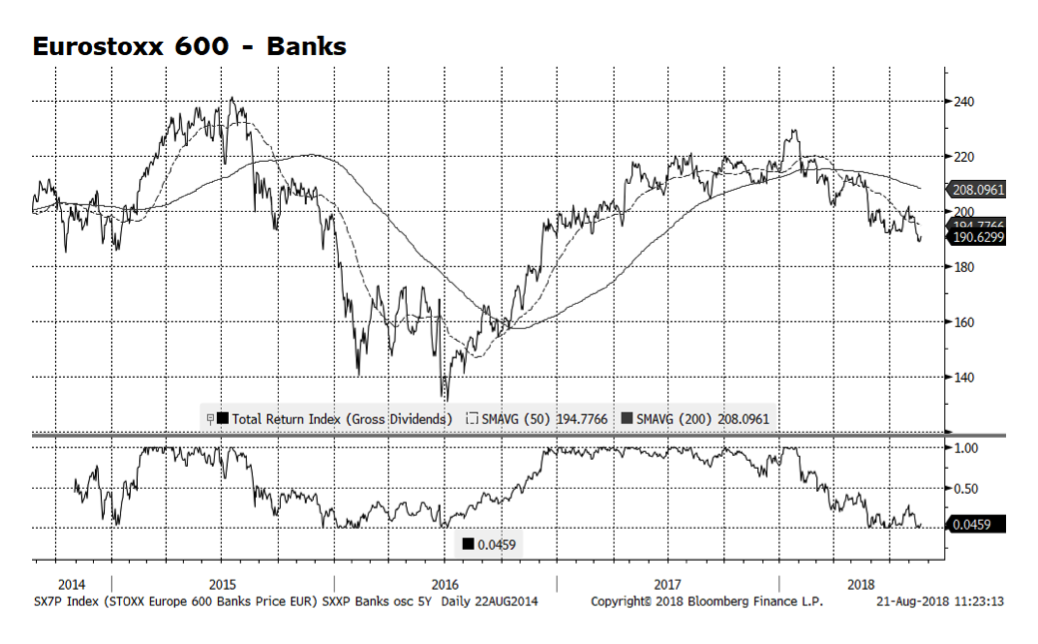
We recently reduced our position in Eurozone equities, which brings our overall exposure to Europe further underweight. One area within European equities that we are quite concerned about is the bank sector. The Italian debt situation is at the heart of the matter as interest rate spreads between Italian and German bonds have been widening. The rising risk premium demanded by investors is one indication of concern regarding the scale of the new Italian governing coalition’s fiscal plans. The deteriorating value of Italian debt impairs bank balance sheets across the region and in turn pushes European bank share prices lower (depicted on the chart below). The interdependence of European banks and government debt has been problematic for some time and measures are being taken by regulators to address this relationship.

