Category: Women and Gender

WCM Chart(s) for April 29, 2022

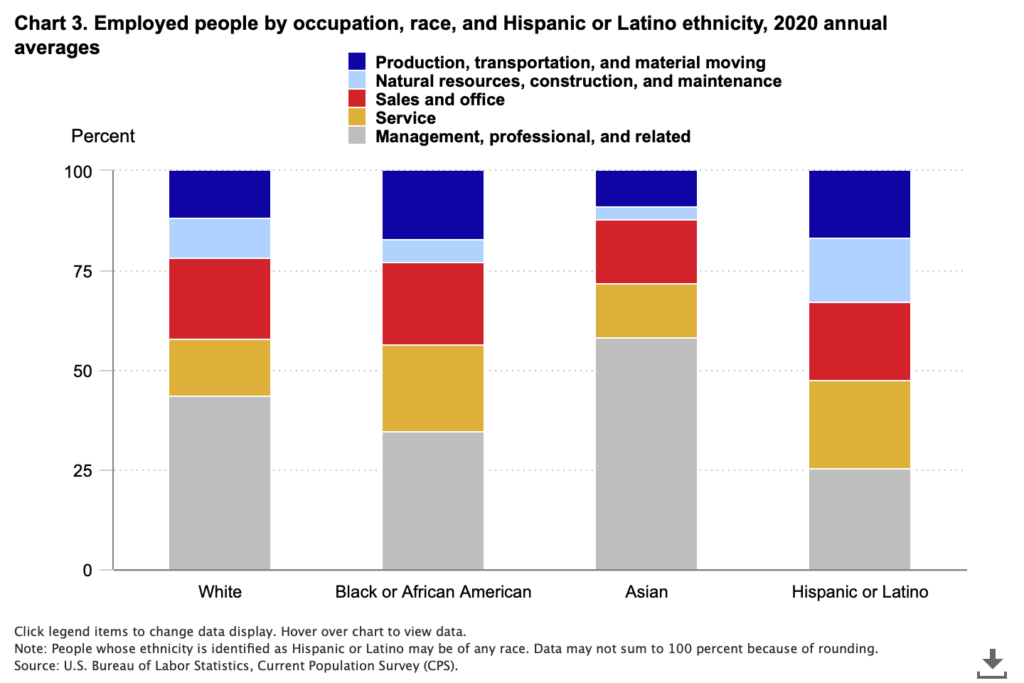
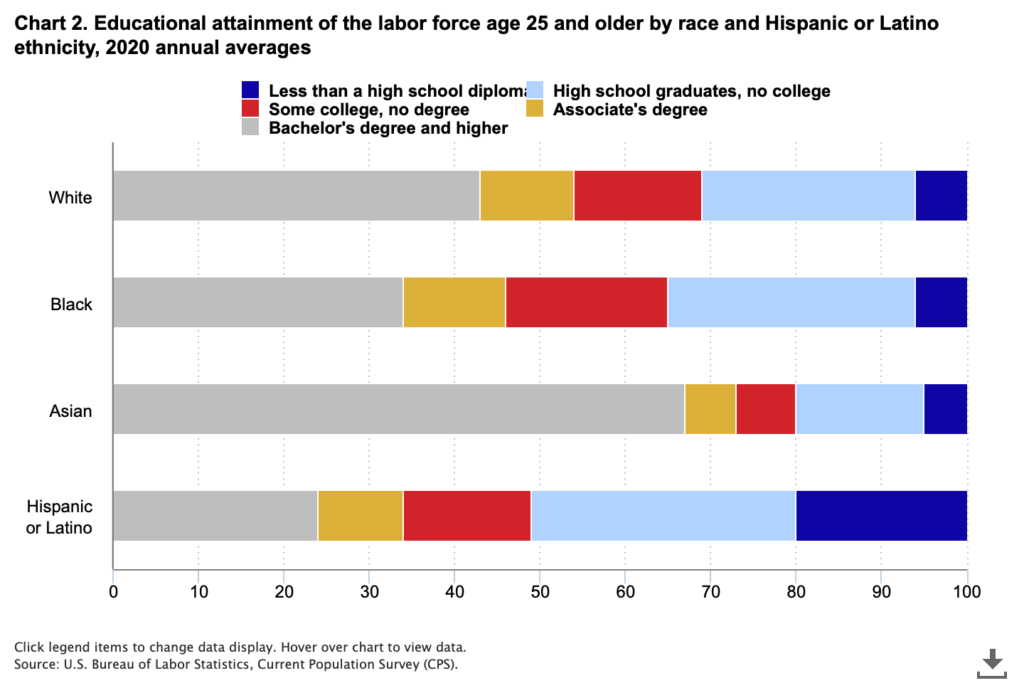
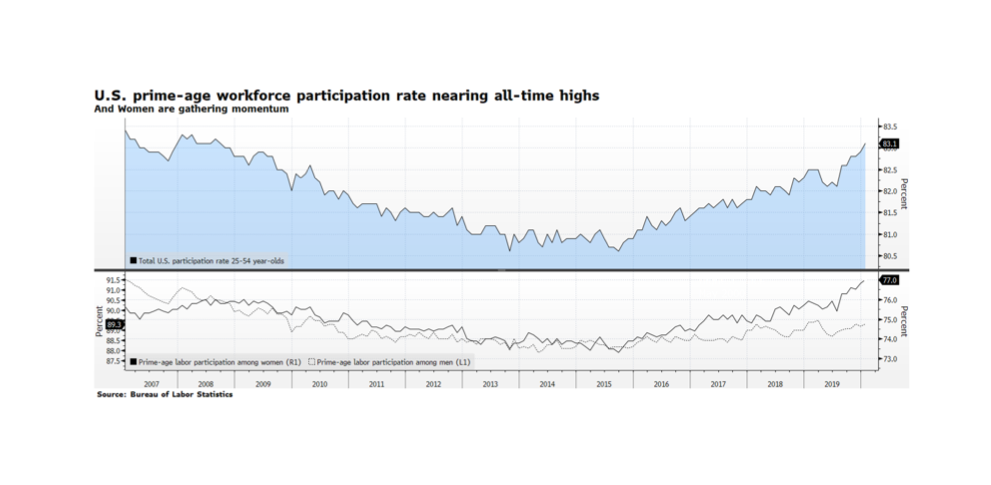
The subject of DE&I – diversity, equity, and inclusion – is having its moment in discussions about companies and workforces. Numerous studies have been conducted attempting to quantify the degree to which all manner of performance metrics improve when access and representation look more like the population at large. We are entirely supportive of a focus on DEI, but not necessarily the focus as it currently stands in the investment world. There is a strong impulse to count and score things to reduce the uncertainty of qualitative observations to quantitative data points, which is not unique to DEI or ESG. DEI happens to lend itself well to that approach because people can be counted. How many women? How many indigenous peoples? How many veterans? What we find is that counting or checking boxes can illuminate deficiencies, but does little to uncover how or why, and fails to understand the interdependencies between different categorizations, such as veterans and health and disability, or race/ethnicity and economic status and education. For instance, a company hiring STEM workers may come up short in its hiring of women or people of color, which could be a failure of policy and practice, or it could be that the supply of qualified candidates is insufficient because universities are not producing a diverse pool of graduates from which to draw. For us, it is a systems-level question. We start with the reasoned assumption that diverse, equitable and inclusive workplaces are more productive and more profitable as well as being more fundamentally just, but our focus is on the systems that perpetuate unproductive biases. That could be and often is rooted in discriminatory practices and systemic biases, but those biases do not exclusively live with the hiring manager or company nor are they fixable in the immediate term no matter how radical a policy shift is implemented. It takes time to establish systems of good governance, cultivate and develop talent, and equalize compensation and promotion opportunities, and those systems extend well beyond the four walls of a given company into our communities and our education, nutrition, health care and other civic services. High performance through an ESG lens where DEI is concerned is establishing and fostering systems and processes that naturally produce a more representative workforce by developing and improving the capability and capacity of candidate workers and opening access to opportunities. [charts courtesy US Bureau of Labor Statistics, Current Population Survey]

WCM ESG Week — Theme 3: Medical Justice and Access to Healthcare

In 2021 when we think of justice we may think of our court system, the disproportionately high incarceration rates of African Americans and Hispanics, inequalities of pay for women vs men, or a significant lack of funding for minority-owned small businesses amongst financial institutions and investment funds. One theme that may not be at the forefront of our word association is medical or healthcare justice, which refers to the opportunity for all to live a healthful life and access equitable and affordable quality care when it is needed.

In 2015 the United Nations launched the 2030 Agenda for Sustainable Development; a plan of action to address universal peace and prosperity for people and the planet by 2030. In it, the United Nations outlined 17 Sustainable Development Goals to address and measure progress on our world’s most pressing issues threatening a healthy and prosperous future. Goal 3, “ensure healthy lives and promote well-being for all at all ages” outlines 13 healthcare targets for equitable global health including reducing maternal mortality rates and ending the epidemics of AIDS, tuberculosis, malaria, etc. (UN SDG, 2015). For a large percentage of the population in the United States, healthcare is an assurance provided by parents, universities, employers or government programs.

However, a study conducted by the Commonwealth Fund in 2020 found that 43.4% of adults aged 19 – 64 were inadequately insured; 9.5% were insured but had a gap in coverage within the last year, 21.3% were fully insured, however out-of-pocket or deductible costs were so high relative to annual income they were considered underinsured, and 12.5% were completely uninsured. Inadequate healthcare coverage exposes individuals and families to high health care costs which often accumulate into medical debt. Among those who reported a medical bill or debt problem, 37% said they had used all of their savings to pay their bills, 40% received a lower credit rating as a result of their medical debt, 31% were forced to transfer medical debt to their credit cards, and one-quarter were unable to pay for basic necessities such as food, heat, or rent (Commonwealth Fund, 2020). 

When we consider health and wellness on a global scale, we must consider all the variables that comprise good health including access to quality nutrition, clean water, sanitation facilities and supplies, basic medical services, and education for disease prevention and treatment. 36% of the world’s population, roughly 2.5 billion people, lack access to improved sanitation facilities, putting them at risk of several preventable diseases including dysentery, cholera, and typhoid (WHO, 2015). Furthermore, nutrition-related factors contribute to approximately 45% of deaths in children 5 years and under. Malnourished children have a higher risk of death from common childhood illnesses such as pneumonia and malaria. Children in sub-Saharan Africa are more than 15 times more likely to die before the age of five than children in high income countries. In addition, 94% of all maternal deaths occur in low and lower middle-income countries. In 2017 alone, 810 women died each day from preventable causes related to pregnancy and childbirth (UN SDG, 2021).  Focusing on what is just in terms of access to basic needs but also access to a clean, safe environment and workplace improves overall wellness and with it productivity and prosperity while reducing the social and economic burdens that come with unwell communities.

Tune into our Wilde Capital Management ESG Week podcast 3: Medical Justice and Access to Healthcare where we discuss the structural challenges to achieving a global basic level of wellness, and how companies both in and out of the broad medical industrial complex can contribute to achieving greater global health with Ingrid Dyott, Managing Director and Portfolio Manager at Neuberger Berman.

https://www.un.org/sustainabledevelopment/health/

https://www.commonwealthfund.org/publications/issue-briefs/2020/aug/looming-crisis-health-coverage-2020-biennial

https://www.who.int/publications/i/item/9789241564977

WCM ESG Week — Theme 2: Banking the Un(der)banked

Deposits in the United States are insured by one of two federal agencies: the Federal Deposit Insurance Corporation or the National Credit Union Administration. In the first quarter of 2021, the Federal Deposit Insurance Corporation reported 4,978 current FDIC-insured commercial banking and savings institutions in the United States providing banking and credit services. In addition, the FDIC acts as the federal supervisor to another 3,209 state-chartered banks and savings institutions in the United States that are not members of the Federal Reserve system. These FDIC-insured and supervised institutions serviced in total over $22 trillion in assets as of quarter one 2021 (FDIC, 2021). In the same time frame, the NCUA reported a total of 5,068 federally insured credit unions servicing $1.95 trillion in assets to over 125 million customers (NCUA, 2021). So, what does it mean to be underbanked or unbanked in one of the richest and most prosperous countries in the world?

Every two years since 2009, the FDIC conducts a household survey in cooperation with the U.S. Census Bureau on the use of banking and financial services in the United States. The survey collects responses from approximately 33,000 households to analyze trends in the financial services industry by geographical, demographic, and economic factors.  The last survey, conducted in 2019, estimated 5.4% of U.S. households were unbanked, meaning that no household member had a checking or savings account at a bank or credit union. This percentage represents approximately 7.1 million households.  Unbanked rates were higher amongst lower-income, less-educated, and Black, Hispanic, and American Indian or Alaska Native households. Among households reported as unbanked, 48.9% cited the reason for not having an account as, “don’t have enough money to meet the minimum balance requirements” (FDIC, 2019). Furthermore, according to a survey conducted in 2019 by the Federal Reserve, an additional 16% of adults are underbanked in the United States, meaning they have a bank account but still use other alternative financial service products such as money orders or pawn shop loans due to lack of affordability or access to traditional and more secure products (Federal Reserve, 2017).

On a global scale, 1.7 billion adults are reported as unbanked in 2017, with China and India accounting for almost 325 million unbanked individuals alone. Women disproportionally represent 56 percent of all unbanked individuals globally (Findex, 2017). Lack of access to traditional banking services hinders individuals’ ability to build emergency funding, execute financial transactions such as paying bills or cashing checks, and results in a lack of access to credit.

Tune into our Wilde Capital Management ESG Week podcast Day 2: Banking the Un(der)banked where we explore financial services trends with Justin Conway, Vice President of Investment Partnerships at Calvert Impact Capital.

https://www.federalreserve.gov/publications/2019-economic-well-being-of-us-households-in-2018-banking-and-credit.htm

https://globalfindex.worldbank.org/sites/globalfindex/files/chapters/2017%20Findex%20full%20report_chapter2.pdf

https://www.ncua.gov/files/publications/analysis/industry-at-a-glance-march-2021.pdf

https://www.ncua.gov/files/publications/analysis/industry-at-a-glance-march-2021.pdf

https://www.fdic.gov/analysis/quarterly-banking-profile/statistics-at-a-glance/2021mar/industry.pdf

WCM Chart of the Week for April 19, 2021

We can’t leave Women’s History Month completely in the rear-view mirror without taking a long and hard look at how impossibly difficult it is for women founders to obtain venture capital funding for their early-stage enterprises. COVID-19 was certainly no friend either, leaving 2020 as the worst year in the last five for women. As compiled by Crunchbase (news.crunchbase.com), a paltry 2% of funding went to women-led startups in 2020, a figure which obnoxiously more than quadruples to 9% with a male co-founder but is still an embarrassment.  The system is not just biased – it is broken. There is no credible case that can be made that, out of a universe comprising more than half the world’s population and representing more than half of the Associates, Bachelors, Masters AND Doctorates awarded just in the US, women barely represent even one fiftieth of the economic potential of men to investors. Next time the question is asked about how we continue to grow the global economy and unlock the full potential of the capital markets given all the headwinds we face, give this answer – Invest. In. Women… Now. And particularly invest in black, indigenous, and other women of color. [chart from Crunchbase News, © 2020]

WCM Chart of the Week for March 15, 2021

UN SDG 5 – “Achieve Gender Equality and Empower All Women and Girls”. During Women’s History Month we again turn our attention to equal access to economic opportunity for women in the American workforce. COVID has further exposed one of the ongoing issues with fair and equal compensation, which is the wage gap between women (and particularly women of color) who are mothers and men who are fathers in the same roles. The National Women’s Law Center gathered data pre-pandemic (2018) assessing the compensation picture for frontline occupations which turned out to be the exact roles hurt worst through the last year of COVID, including housekeepers, retail, wait staff, childcare, home health and nursing. Between 15 and 35% are working mothers, and of those as much as 74% of color. The gap between working mothers and fathers ranged from 36 cents down to 13 cents per hour. That is a bit of an abstraction. This week’s chart, taken from the NWLC and the 2018 American Community Survey, illustrates that gap much more starkly in real dollars on an annual basis, and points to the downstream economic drag on food, housing, education, job training and other expenditures and investments families make for healthy living and vibrant communities and economies.

WCM Chart of the Week for February 10, 2020

The US Bureau of Labor Statistics has been reporting impressive trends across many demographic categories for several quarters. One of the most important trends we see is development in the female workforce. Total US Labor Market participation reached an impressive 83.1% rate in the key age category of 25-54 year-olds. These levels have not been reached since the pre-crisis era over a decade ago. The real story is gains made by female workers. Women in this demographic have led the overall participation rate, rising from 73.3% in late 2015 to its latest reading of 77%, three times the percentage gain of men in the same category who rose from 88.2% to 89.3% over the same period. Even with this good news, we cannot lose focus on UN SDG #5 (Achieve Gender Equality and Empower All Women and Girls). Women in the US still earn only about 80 cents on the equivalent dollar wage for a man, a gap which expands further for Latinas, black women and women of Native American and Hawai’ian descent. [Chart courtesy Bloomberg LP © 2020, data US BLS]