Category: UN Sustainable Development Goals (Page 1 of 3)

Juneteenth

There is so much brilliant historical and current writing on the significance of this day that we eagerly defer to the scholarship around it for the authoritative sociopolitical and historical view. Our business is of course investing, and we are taking today to reflect from an ESG perspective on how chattel slavery factors into where people allocate capital and how they benefit. There is a tragic reality that major components of our economy and significant companies and industries have less-than-savory origins connected to the taking of humans and their work, including after constitutional slavery ended and a new form of taking through the carceral and other systems replaced it. This leads to questions of the justice and propriety of investing and profiting where some of today’s prosperity is rooted in historical atrocities. Entire schools of thought have emerged on how to rectify these historical social and economic injustices, and the earliest beginnings of an institutional and societal reckoning are afoot. But, as allocators of capital in the here and now, we recognize that this is not exclusively an exercise in righting wrongs from the 17th to 19th (and early 20th) centuries.

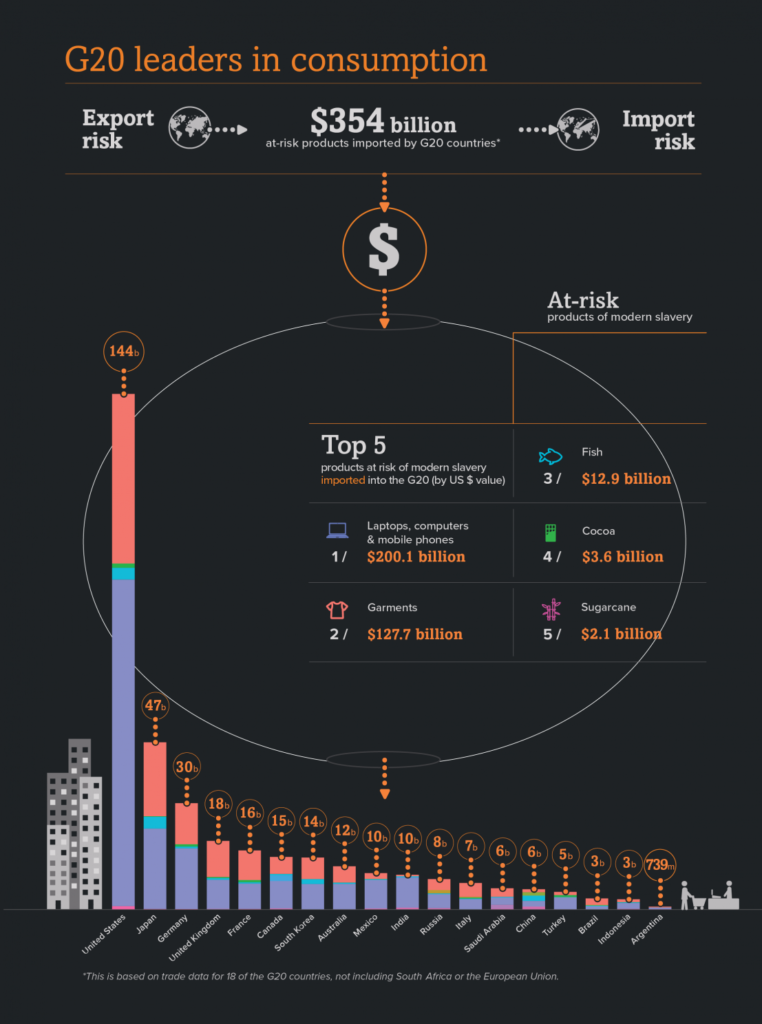
We have written about this before, but it warrants repeating today – according to the 2018 report from the Global Slavery Index, as many as 40 million people globally, the equivalent of the population of California, are in some form of modern slavery, 25 million of which are in forced labor. It is believed that the social, geopolitical and economic stresses of the global pandemic may have further exacerbated this since 2018, and the global rise in inflation may do even more damage in this regard. This is not a contemplation of past deeds or a chapter in a history book. The GSI estimates the risk to imported products by G20 countries at $354 billion, and exposure in just the top 5 at-risk industries crosses technology (computers and mobile phones for instance), apparel, fish, cocoa and sugarcane. It would be difficult to look at any current investment portfolio and not see the potential risk of profiting from slavery in supply chains.

General Order #3 was a monumental moment, but 157 years later there is still work to do in our investing, our consumption and our government policy to truly wring the unjust economic advantages of slavery out of global systems of commerce. [image from the Global Slavery Index (c) 2018]

WCM Chart of the Week for April 4, 2022

With the release of “Climate Change 2022: Mitigation of climate change”, which is the third segment of this year’s sixth assessment report (AR6) from the IPCC, most of the attention will be focused again on the doomsday charts. One of the notable ones in the press packet is entitled “We are not on track to limit warming to 1.5 (deg) C.” But, the report is surprisingly optimistic in one very critical sense – it declares the problem addressable if global action is taken promptly and capital is called in off the sidelines to drive a transition in energy, land use, industry, urban zones, buildings and transportation that could halve GhG emissions by 2030. At this point the debate then usually swings to the nature of capitalist systems and that capital will flow to where it can be used most efficiently and to greatest effect (e.g. risk-adjusted return), and there it stops. Advocates for changing policy on climate will trot out the “if we don’t act we’ll all die and your money won’t mean anything” argument, having failed to learn that existential threats don’t tend to deter markets until they become existential realities, supporting a party-like-it’s-1999 mentality. However, one slide in the press packet which probably won’t get much attention actually holds the key to activating capital entitled “(In some cases) costs for renewables have fallen below those of fossil fuels.” This is profound in that it doesn’t require the rest of the science or policy or existential concerns to affect the flow of capital. It is simply becoming cheaper to convert today’s sunshine and wind into electricity and shove it into batteries than to dig up fossilized sunshine from more than 65 million years ago and burn it. Even with investment and innovation in efficiency, modern society will continue to be increasingly energy intensive, and as more of the world’s population joins the middle class, utilization will become even more widespread. Intelligent allocators of capital will pursue the cheaper inputs that will meet that demand.

The Doomsday Glacier — It’s Not a Bond Villain’s Plot. It’s Worse.

While many other things dominated the headlines from the Russian/Ukrainian conflict to inflation and policy response to COVID-19 Omicron part deux, something that was considered mostly unthinkable by scientists happened in Antarctica. According to the US National Ice Center (https://usicecenter.gov/PressRelease/IcebergC38):  “(USNIC) has confirmed that iceberg C-38… has calved from the Conger Ice Shelf in the Wilkes Land Region of Antarctica. As of March 17, C-38 was centered at 65° 40′ South and 102° 46′ East and measured 16 nautical miles on its longest axis and 10 nautical miles on its widest axis. C-38 comprised virtually all that remained of the Conger ice shelf, which was adjacent to the Glenzer Ice Shelf which calved last week as iceberg C-37.” Eyes had been on another part of Antarctica over concerns about the potential collapse of the so-called “Doomsday glacier” — Thwaite’s glacier. But, Conger beat Thwaite to the punch with a break-away described as nearly the size of Los Angeles. Our attached chart from NOAA NCEI chronicles the decline in global sea ice just since 1979. When split into hemispheres, Northern loss is faster at -2.68% vs. “only” -0.33% for Southern (decadal trend). The fact Conger collapsed and Thwaite’s is trying is deeply concerning because it illustrates just how fragile the system is. Failure to adjust climate-changing activities and to start building resiliency and adaptation into industries and communities poses real threats to economic stability and prosperity and the performance of investments over a shorter-term horizon than many expect.

Charting COP-26 — I know you are disappointed

“I know you are disappointed”. That was UN Secretary General Gutteres’ message to “young people, indigenous communities, women leaders, and all those leading the charge on climate action” as COP-26 adjourned in Glasgow. From the perspective of those four groups, representing rather a large percentage of the planet’s population, “disappointed” might be the diplomatic understatement of this century as they cling to the edge of an existential cliff. Can an institution that by design is meant to move (extremely) slowly and deliberately and with total consensus actually address something with this much urgency?

Perhaps the issue is one of framing. From the UN’s perspective, if they were presented with an international conflict where food systems were to collapse, millions of lives were to be at risk, millions were to become refugees, hundreds of billions of dollars of infrastructure were to be destroyed, and this catastrophe would know no borders and respect no nation, law, or military might, what would it do? Guns pointed at each other is actually one of many societal byproducts of climate change, but for this thought experiment we should focus on the magnitude of devastation and hardship that is happening without a shot being fired. If slowing things down is the UN’s true nature, what can it slow down to forestall the full impact of this emerging catastrophe while it finds a permanent fix? What resources would it mobilize?

197 nations are signing the “Glasgow Climate Pact”, but the two most populous countries insisted on a language change from “phase out” to “phase down” coal. That fundamentally changes the coal question from one of “when” to one of “if”. Again, looking at other activities that pose imminent threat to life and land that bring UN involvement, say, nuclear weapons development or massing troops on a national border, the distinction between “phase out” and “phase down” would be of monumental import. We are mired in process over outcome.

On the UN’s news feed for November 3rd, they reported “It’s ‘Finance Day’ at COP26, and the spotlight is on a big announcement: nearly 500 global financial services firms agreed on Wednesday to align $130 trillion – some 40 per cent of the world’s financial assets – with the climate goals set out in the Paris Agreement, including limiting global warming to 1.5 degrees Celsius.” At the UN above all other institutions, words mean something. What does “align” mean? Is this another “phase down” vs. “phase out” situation? For what we do on a regular basis as allocators of capital within that ecosystem of global financial services firms, we are forced to ask if this is a commitment to the largest greenwashing campaign in history. As we have written and spoken about repeatedly, we are looking to see whether this is the first step of many along a path to more sustainable capital allocation, or window dressing to manage optics. Intentionality is everything.

As noted previously, it is going to take the mobilization of private and not government capital to reach the intensity and scale of development necessary to forestall the worst effects of the climate crisis. Governments, who already failed to live up to their prior pledges to deploy $100 billion annually, should instead pivot to facilitating marketplaces and lowering barriers and allow the free market to do its work. Shifting capital to a regenerative model for food, energy, water, and infrastructure could unlock an economic boom and broaden participation in a way which would be historic in defining the 21st century.

Charting COP-26 — Is that a pie in the sky?

Today at COP-26 we received a declaration entitled “INTERNATIONAL AVIATION CLIMATE AMBITION COALITION”. Commercial aviation is a non-trivial contributor to GhG emissions. The widely cited statistic is that, if the industry were a nation, total output would rank it 7th after Germany. From a climate policy point of view though, we are asking whether the focus is correct on the part of policymakers and signatory nations. The International Civil Aviation Association (ICAO) already set goals a decade ago of improving efficiency by 2% per year, which was not out of line with historical trends. Improvements in jet engine efficiency along with innovations in avionics and lighter airframes have led to steady increases in efficiency per passenger seat for decades. It makes absolute commercial sense because of the amount of the economics of air transportation consumed by fuel costs. Each generation of aircraft upgrades provides significant improvements. Fuel burn for new aircraft fell by nearly half from 1968 to 2014. We are questioning the focus because unlike other industries like power generation, there are no viable alternatives on the visible horizon. Coal plants can be decommissioned in favor of natural gas, or going all the way to wind, solar, hydro, etc. ICE cars and trucks can be replaced with EVs. There is no EV plane (yet). The industry is doing its part in terms of innovation and of course there is room to do more. The real burden is behavioral though, and yet that is nowhere to be found in the COP statement. There are commitments to alternative fuels and technologies, but nothing about curbing unnecessary air travel, making more efficient aircraft affordable for developing nations rather than selling them hand-me-down decades-old aircraft, or changing the business mix to favor flying larger and more efficient airframes over the explosion in use of small, less efficient, commuter aircraft for many routes. [chart from International Council on Clean Transportation, Fuel Efficiency Trends for New Commercial Jet Aircraft: 1960 to 2014, Anastasia Kharina, Daniel Rutherford, Ph.D.]

Charting COP-26 and The Global (In)Action Agenda for Innovation in Agriculture, November 9, 2021

On November 6th, we got a clever hashtag mention — #climateshot – and a “Global Action Agenda”: Increase investment in agricultural research and innovation to create more climate-resilient, low-emission technologies and practices; Focus at least a third of agricultural research and innovation investments deliver demand-driven solutions across food systems, to protect nature and limit climate change; Showcase successful business models and promote public-private partnerships that deploy these innovations on the scale needed to meet the climate and food security challenge; Forge consensus on the evidence of what works, and facilitate inclusive dialogue among food and climate champions around the world. A lot of the right stakeholders (160 institutions, NGOs, countries and companies) are at the table, and there are four key initiatives: “The 100 Million Farmers Multi-Stakeholder Platform, led by the World Economic Forum. The Global Research Alliance on Agricultural Greenhouse Gases (GRA) initiative, which brings countries together to find ways to grow more food without growing greenhouse gas emissions. The new CGIAR organisational structure, research and innovation strategy and portfolio of initiatives. ClimateShot allies from the impact investment community comprise over 20 investors, funders and initiatives, including innovative funds aiming to mobilise over US$5 billion in financing to transform agriculture for people, nature and the climate.” And that is where it all falls down. 20 investors, funders and initiatives and $5 billion in capital is not going to transform anything. (Re)Learning from our world indigenous communities how to shift, or shift back, to regenerative agricultural practices has the potential to address a major carbon problem while also making significant strides in stewardship of water systems, all the while feeding the planet and providing economic opportunity to individuals, families, communities, companies and countries. It starts at the grassroots. This graphic, courtesy of Marc Barasch and Green World Ventures, is a hand illustration of a regenerative approach to smallholder farming already employed in Nigeria which at scale addresses a myriad of economic, nutritional and climatological challenges. What is old is very much new again, and requires activation of those 100 million farmers as well as activation of sufficient capital, from far more than 20 stakeholders, to catalyze a global change.

Charting COP-26 and the Path to Zero, November 5, 2021

Yesterday a consortium of mostly Anglo and European countries signed a statement affirming a commitment to “deliver sustainable, green and inclusive economic growth to meet the challenge of decarbonising our economies, in line with limiting the global average temperature increase to 1.5°C above the preindustrial levels.” The statement covers six categories of targets — Support for workers in the transition to new jobs, social dialogue and stakeholder engagement, economic strategies, local, inclusive, and decent work, supply chains, and Paris Agreement reporting. The important thing we note in this statement is the recognition of the necessity of public/private partnership. The path to zero requires industry and market-wide activation of capital and corporate infrastructure in the private sector and regulatory and reporting frameworks from the public sector that facilitate the private sector’s work. This chart from a May 2021 International Energy Agency (IEA) report “Net Zero by 2050: A Roadmap for Global Energy Sector” provides an excellent overview of the business and industry targets that must be met with the facilitation and support of both governments and NGOs over the next 30 years. The signatories to the statement make sense in that these are many of the wealthiest industrialized nations that have both the capital to pursue this agenda and a high degree of responsibility for having brought us to the climate precipice. However, the lack of presence from Australia, China and Japan is concerning as they must help lead among the community of nations as the most developed and prosperous (polluting) countries of the Asia-Pacific region.

Charting COP-26, Take 2, November 3, 2021

Jair Bolsonaro isn’t there either. While the President of Brazil is not in attendance, the country is still represented, but one is forced to wonder what the degree of commitment is when the boss chooses not to attend for “strategic” reasons. On the positive side of the ledger, even with Bolsonaro’s absence Brazil signed on to the pledge between 100 signatory countries to end deforestation by 2030. And reinforcing our point about the real action being with private enterprise and not with government, dozens of global financial services companies also are committing to discontinue investment in and financing for businesses and other concerns engaging in or profiting from deforestation. Today’s charts look at the trends and patterns in Amazonian deforestation. Brazil made great positive strides over the past decade dramatically improving over the prior twenty years. However, with Bolsonaro’s election we observe a significant jump in activity in 2019, and expect similar increases in 2020 and 2021 (not yet reflected in the data). The second chart from NASA provides a visual representation of reduction in vegetation in the Amazon in a period between 2000 and 2008 to illustrate the patterns of destruction. Ironically, note that the pattern looks like leaf veins, propagating from main roads to local roads and spreading out into the forest until larger and larger tracts of land are cleared. Crops like soy account for much of the native vegetation cleared, and one of the biggest importers of Brazilian soy in the last couple years is China. No Bolsonaro. No Xi. Starting to see a pattern there too? 

Charting COP-26, November 2, 2021

We will spend a bit of time in the coming days highlighting charts we think are material as they pertain to the finance aspects of the UN Conference of the Parties (COP-26) taking place in Glasgow. Our starting point for expectations on outcomes for COP-26 is low. There might be a few more reasons for optimism than there were going in to and coming out of the last convening that Sec. Gen. Guterres basically labeled a failure. But, with two linchpins in the global climate machinery – Russia and China – not present, even total agreement by the attending parties amounts to a half measure. More importantly, we do not believe the answer to the climate challenge resides in the hands of nation-states at the governmental level. As can be seen by these charts from the OECD on how many billions of dollars annually are deployed globally to address adaptation and mitigation across sectors, this is the proverbial small-barrel solution to a big-barrel problem. Many estimates rise into the trillions of dollars USD per year that must be mobilized in order to achieve the stated goal of avoiding the 1.5 degree scenario and address the adaptation and mitigation needs for climatological changes that are already established. That can only come from markets and industry, so the best possible action in Glasgow would be for governments to agree to create the conditions for private (and public) enterprise to succeed and thrive in building a better climate future and then get out of the way. [Charts from Climate Finance Provided and Mobilised by Developed Countries: Aggregate Trends Updated with 2019 data, OECD iLibrary]

WCM Chart of the Week for August 18, 2021

The Intergovernmental Panel on Climate Change (IPCC) released the Working Group I contribution to the Sixth Assessment Report which will arrive fully in 2022. Among the reaffirmed findings in the report is that we are already most of the way to the 1.5 degree Celsius threshold over pre-industrial global temperatures where climate-related damage becomes more widespread and harder to turn back. We wanted to examine what that means in practical human terms. According to NOAA (R. Lindsey, Jan. 25, 2021), we have seen 8 – 9 inches of sea level rise since 1880, and in some ocean basins nearly that much just since the beginning of the satellite record. Taking the IPCC findings into account and with NOAA’s own models, sea level could rise another foot over 2000 levels by the end of the century. The two images provided are from NOAA’s Sea Level Rise Viewer. The first is a view of the heart of the Northeast Corridor from Long Island Sound down to the Chesapeake at the current “Mean Higher High Water”. The principal shading illustrates the population vulnerability to sea level rise. The second is the same view under a 1 foot MHHW scenario. Note the amount of coastal inundation, particularly around high density and vulnerable populations. The amount of property and population at risk in human and dollar terms is staggering in this relatively concentrated area, and has implications for municipalities, commercial real estate, infrastructure, corporations, maritime interests, tourism, and residential neighborhoods, and all the supply chains and institutions elsewhere like banks and insurance companies that are exposed to that risk. Smart investing requires thinking about mitigation, resiliency, and adaptation, hallmarks of ESG investing and increasingly becoming part of mainstream investing.

« Older posts