Category: Trade

WCM Chart of the Week for February 22, 2022

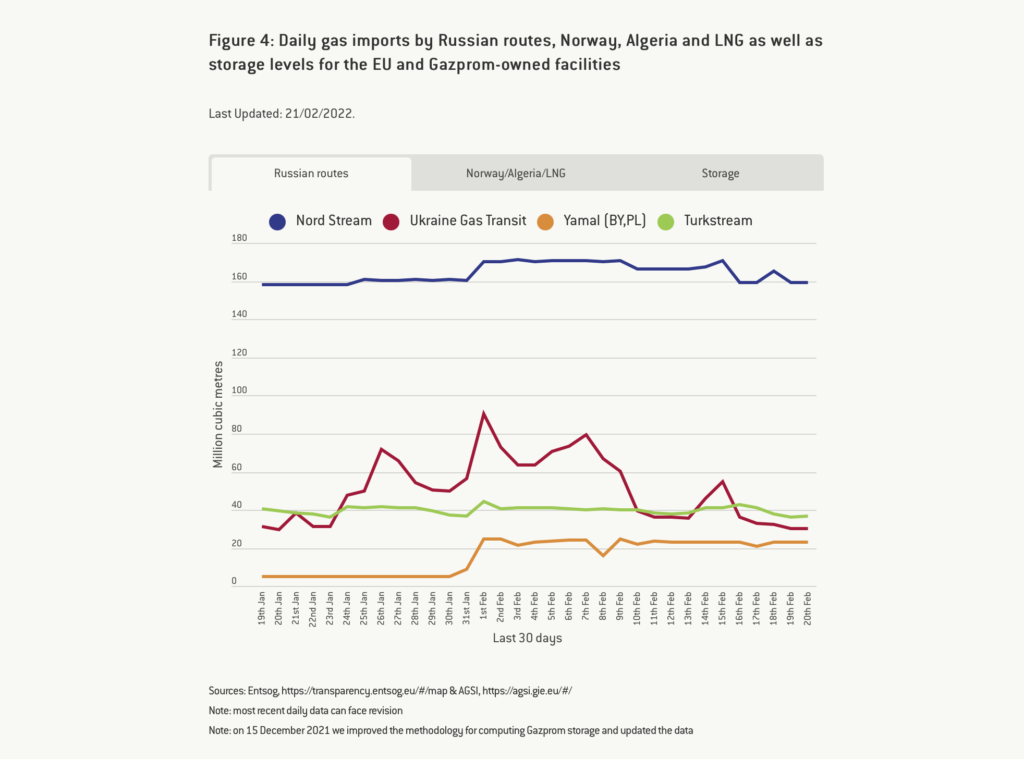
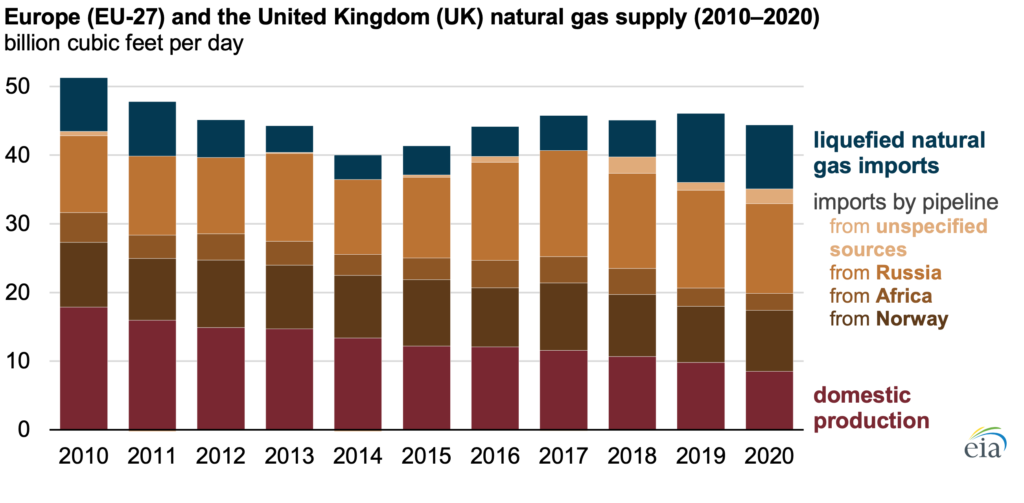
This week we get to take a break from talking about inflation to talk about… inflation. Although, in this case, what effects Russia’s moves on Ukraine might have. Russia’s economy is the 11th largest in the world as measured by nominal GDP, which seems significant until we realize it is smaller than Canada’s and 1/10 the size of China’s. Ukraine is 55th. Where Russia is most consequential in terms of their economy on the world stage is energy – petroleum and natural gas. Europe is a net importer of natural gas, a significant portion but not all of which comes from Russia. They have been increasing LNG imports from the US and Qatar, but that is mostly offset by a steady decline in domestic production. Natural gas is not the only major piece of the European energy portfolio, but it is material. Prices have already been high, and the decision to delay certifying Nord Stream 2 in response to Russian aggression means little relief is on the way. Globally, “OPEC+” has been falling short of targets to increase production post-COVID wind-down and the Ukraine conflict will not help climbing prices for oil either. The West is putting the framework for a new sanctions regime in place but that will mostly be about deciding who takes what share of the economic pain to box out Russia. Rising oil prices have similar effects on the economy as rising interest rates, so we are interested to see how the Fed digests the changing macroeconomic environment and the need to be aggressive on policy rates later in the year. Looking longer term, assuming the priority does not become preventing total war as Putin tries to reassert the borders of the former Soviet Union, we see this moment as a tipping point for Europe to accelerate their transition to a low-carbon future because it is an undeniable security imperative for the EU member states.  [Sources: US Energy Information Administration https://www.eia.gov/todayinenergy/detail.php?id=51258 and McWilliams, B., G. Sgaravatti, G. Zachmann (2021) ‘European natural gas imports’, Bruegel Datasets, first published 29 October, available at https://www.bruegel.org/publications/datasets/european-natural-gas-imports/]
WCM Chart of the Week for November 29, 2021

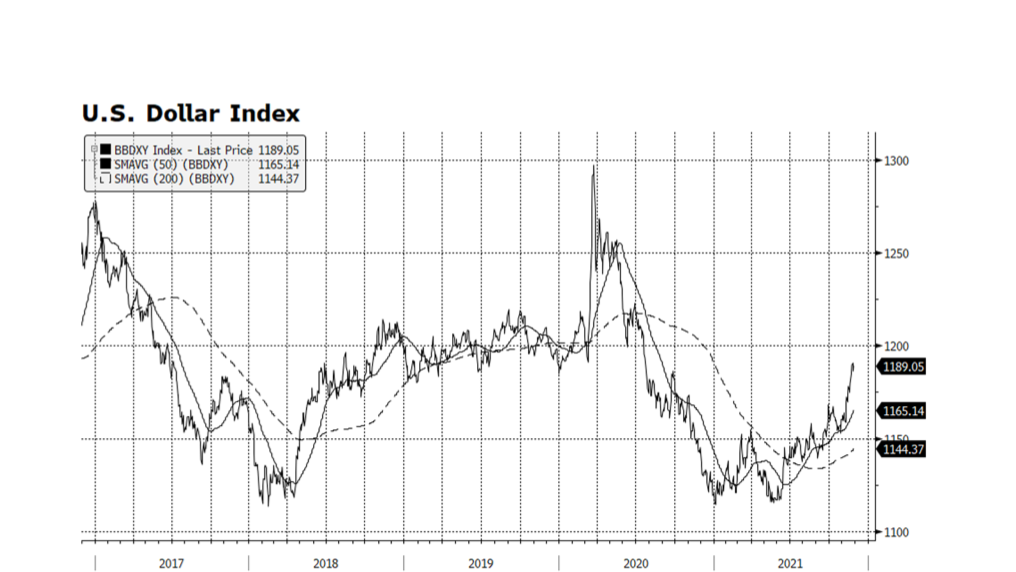
Consumer prices in the US are observably on the rise across a broad array of products and services. The Federal Reserve’s preferred inflation gauge, the PCE, last week registered a 4.1% annual increase, well above the Fed’s target. The causes of higher prices are well known, ranging from supply chain bottlenecks to raw material scarcity to higher energy costs to a shortage of transportation personnel. Adding to the inflationary mix is strength in the US dollar which has recovered over 6% according to the Bloomberg US Dollar index, comprised of a basket of major currencies. The dollar has recovered to pre-pandemic levels and could strengthen further as the Fed begins to reign in liquidity towards the end of 2022 if not earlier. Continued dollar strength could provide some inflationary relief in the form of lower import prices and could be justified given strong US economic growth and the interest rate differential between the US bonds and the rest of the world. As this week’s chart illustrates though, currency movements are notoriously difficult to predict. [chart courtesy Bloomberg LP © 2021]

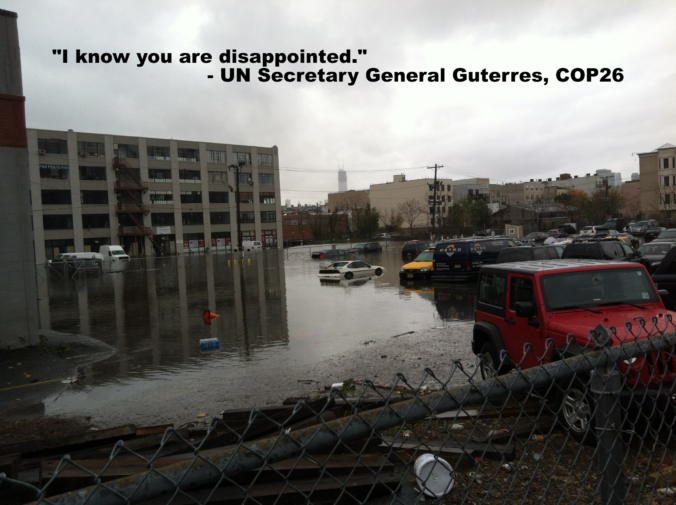
Charting COP-26 — I know you are disappointed

“I know you are disappointed”. That was UN Secretary General Gutteres’ message to “young people, indigenous communities, women leaders, and all those leading the charge on climate action” as COP-26 adjourned in Glasgow. From the perspective of those four groups, representing rather a large percentage of the planet’s population, “disappointed” might be the diplomatic understatement of this century as they cling to the edge of an existential cliff. Can an institution that by design is meant to move (extremely) slowly and deliberately and with total consensus actually address something with this much urgency?

Perhaps the issue is one of framing. From the UN’s perspective, if they were presented with an international conflict where food systems were to collapse, millions of lives were to be at risk, millions were to become refugees, hundreds of billions of dollars of infrastructure were to be destroyed, and this catastrophe would know no borders and respect no nation, law, or military might, what would it do? Guns pointed at each other is actually one of many societal byproducts of climate change, but for this thought experiment we should focus on the magnitude of devastation and hardship that is happening without a shot being fired. If slowing things down is the UN’s true nature, what can it slow down to forestall the full impact of this emerging catastrophe while it finds a permanent fix? What resources would it mobilize?

197 nations are signing the “Glasgow Climate Pact”, but the two most populous countries insisted on a language change from “phase out” to “phase down” coal. That fundamentally changes the coal question from one of “when” to one of “if”. Again, looking at other activities that pose imminent threat to life and land that bring UN involvement, say, nuclear weapons development or massing troops on a national border, the distinction between “phase out” and “phase down” would be of monumental import. We are mired in process over outcome.

On the UN’s news feed for November 3rd, they reported “It’s ‘Finance Day’ at COP26, and the spotlight is on a big announcement: nearly 500 global financial services firms agreed on Wednesday to align $130 trillion – some 40 per cent of the world’s financial assets – with the climate goals set out in the Paris Agreement, including limiting global warming to 1.5 degrees Celsius.” At the UN above all other institutions, words mean something. What does “align” mean? Is this another “phase down” vs. “phase out” situation? For what we do on a regular basis as allocators of capital within that ecosystem of global financial services firms, we are forced to ask if this is a commitment to the largest greenwashing campaign in history. As we have written and spoken about repeatedly, we are looking to see whether this is the first step of many along a path to more sustainable capital allocation, or window dressing to manage optics. Intentionality is everything.

As noted previously, it is going to take the mobilization of private and not government capital to reach the intensity and scale of development necessary to forestall the worst effects of the climate crisis. Governments, who already failed to live up to their prior pledges to deploy $100 billion annually, should instead pivot to facilitating marketplaces and lowering barriers and allow the free market to do its work. Shifting capital to a regenerative model for food, energy, water, and infrastructure could unlock an economic boom and broaden participation in a way which would be historic in defining the 21st century.

Charting COP-26, Take 2, November 3, 2021

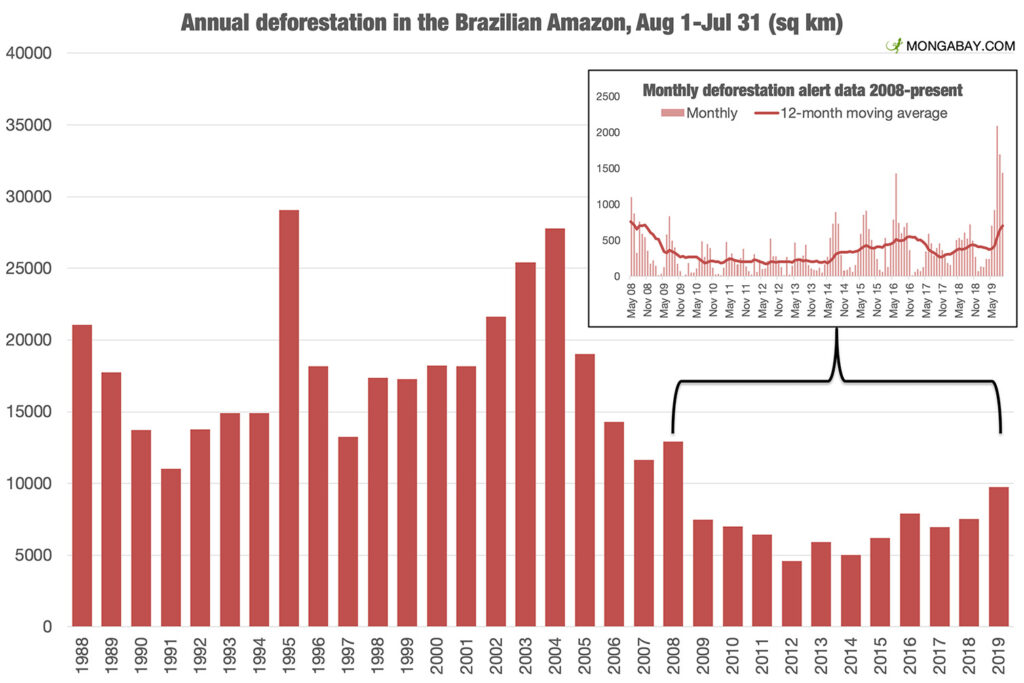
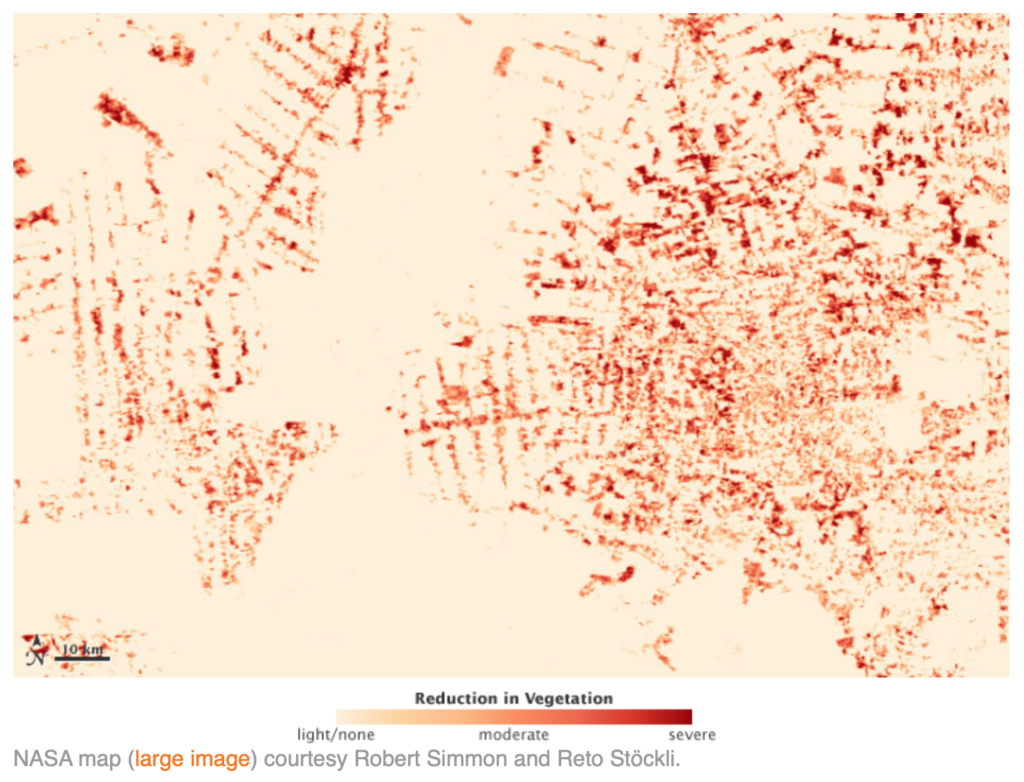
Jair Bolsonaro isn’t there either. While the President of Brazil is not in attendance, the country is still represented, but one is forced to wonder what the degree of commitment is when the boss chooses not to attend for “strategic” reasons. On the positive side of the ledger, even with Bolsonaro’s absence Brazil signed on to the pledge between 100 signatory countries to end deforestation by 2030. And reinforcing our point about the real action being with private enterprise and not with government, dozens of global financial services companies also are committing to discontinue investment in and financing for businesses and other concerns engaging in or profiting from deforestation. Today’s charts look at the trends and patterns in Amazonian deforestation. Brazil made great positive strides over the past decade dramatically improving over the prior twenty years. However, with Bolsonaro’s election we observe a significant jump in activity in 2019, and expect similar increases in 2020 and 2021 (not yet reflected in the data). The second chart from NASA provides a visual representation of reduction in vegetation in the Amazon in a period between 2000 and 2008 to illustrate the patterns of destruction. Ironically, note that the pattern looks like leaf veins, propagating from main roads to local roads and spreading out into the forest until larger and larger tracts of land are cleared. Crops like soy account for much of the native vegetation cleared, and one of the biggest importers of Brazilian soy in the last couple years is China. No Bolsonaro. No Xi. Starting to see a pattern there too? 

WCM ESG Week — Theme 4: The Business of Human Trafficking

“It’s really important that people begin to understand and have transparency when making purchasing decisions as consumers… what high-risk businesses are. When you are paying X, Y, or Z for a shirt or an outfit, there are people sacrificing their lives to bring it to that cost level.” (Bongiovanni, WCM ESG Week, 2021). In 2016, an estimated 40.3 million people were living in some form of modern slavery, whether through sex or labor trafficking or domestic servitude. Although declared illegal in almost every country, human trafficking or modern slavery persists at deplorable rates, even within developed nations like the United States.  No community is immune, and no age, race, gender, or nationality is exempt from being exploited. Traffickers often use violence, manipulation, or false promises of high-paying jobs or romantic relationships to entice victims into trafficking situations. They target vulnerable individuals who may be experiencing economic hardship or emotional or psychological distress, or who may live in areas of natural disaster, political instability, or civil unrest (Homeland Security, 2020). In the United States alone, the FBI estimates over 100,000 children are victims of sex trafficking. Children in the foster care and welfare system are particularly vulnerable due to a lack of family support and stability. 60% of child sex trafficking victims recovered through FBI raids in 2013 were found to be on record in the foster care or group home systems (NFYI, 2015). But, our youth are not the only individuals at risk.

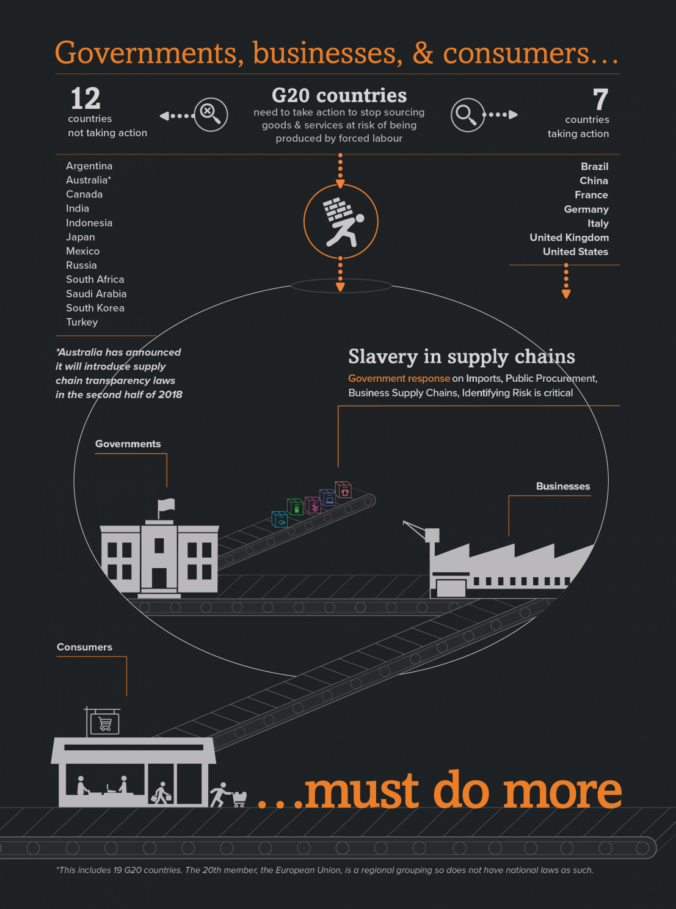
Globally, 46% of human trafficking victims are adult females, 19% young girls, 20% adult males, and 15% young boys. Human trafficking can take on many forms including forced marriages, prostitution, and domestic servitude. Trafficking even infiltrates private and public supply chains through forced labor and debt bondage, many within the sectors of construction, manufacturing, agriculture, mining, fishing, and forestry. Collectively, G20 countries (the intergovernmental forum comprising 19 countries and the European Union aimed at addressing major global issues) are responsible for importing $354 billion worth of at-risk products each year. The top products, by each country according to US dollar value include apparel and clothing accessories, sugar cane, coal, fish, timber, and laptops, computers, and mobile phones. Disappointingly, only seven G20 countries have formally enacted laws, policies, or practices to halt business and government sourcing goods and services produced by forced labor (Global Overview, 2020).

So, what can we do as consumers and investors to ensure that we do not contribute to or support the exploitation of “human capital”? “One of the most important first steps to addressing the problem is discovery and disclosure. Transparency will assist a variety of stakeholders, from customers and business partners to investors and lenders, to make more intelligent decisions about deploying capital. The end goal is to change how companies build those supply chains and wring slavery out of the system” (Sloss, 2019). Tune into our podcast WCM ESG Week Day 4: The Business of Human Trafficking with Michele Bongiovanni of HealRWorld and Distributed Data Network as we discuss the issue of human trafficking, its widespread and fundamentally objectionable consequences, its interwovenness in the Developed West, and what actions are being taken to weed out and eliminate trafficking within our supply chains.

https://nfyi.org/issues/sex-trafficking/

https://www.dhs.gov/blue-campaign/what-human-trafficking

https://www.unodc.org/unodc/en/data-and-analysis/glotip.html

https://regenerativeinvestmentstrategies.com/wp-content/uploads/2019/11/Citywire-USA-September-2019-Breaking-Free.pdf

https://www.globalslaveryindex.org/

WCM Chart of the Week for January 4, 2021

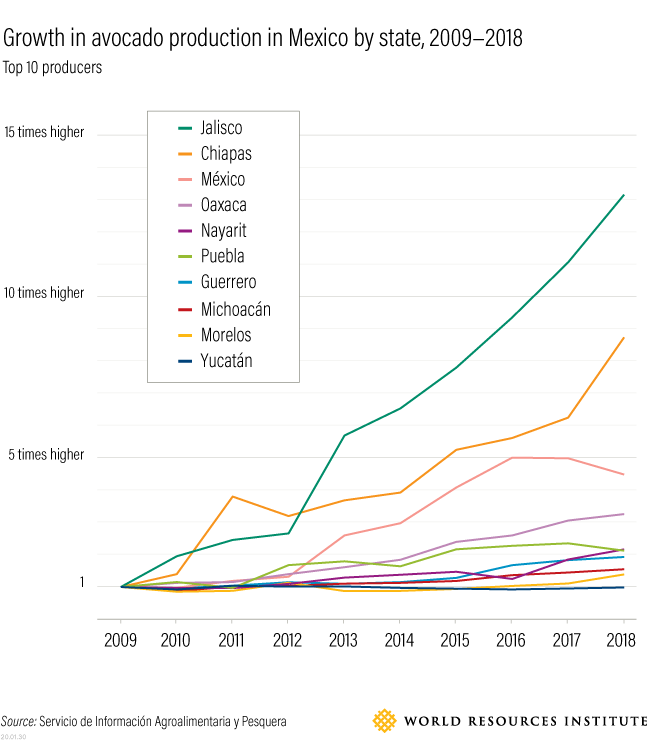
What happens when one ESG priority comes into conflict with another? This week we examine a chart from the World Resources Institute (www.wri.org) of data from the Servicio de Información Agroalimentaria y Pesquera chronicling a decade of growth in avocado production in Mexico. Avocados play on ESG themes of healthy eating, job creation and economic opportunity. Unfortunately, the explosion of consumption, primarily in the US as a result of NAFTA, of Mexican avocados has fueled deforestation, draining of aquifers, soil degradation, increased CO2 emissions, threatens indigenous species and even triggers small earthquakes. According to various studies assembled by the World Economic Forum, avocado groves consume multiples of the water of indigenous forest, and the fruit has an end-point carbon emissions footprint many times that of bananas. As with other monocultures like palm in Indonesia, avocado has brought economic opportunity to areas that badly need it like Michoacán province, but at a profound and unsustainable cost. Conscientious consumption and deploying capital to find more sustainable methods of cultivation without depriving Michoacán of needed money and opportunity are examples of where ESG is headed to address whole-systems challenges rather than focusing narrowly on single issues or ideas.

WCM Chart of the Week for November 23, 2020

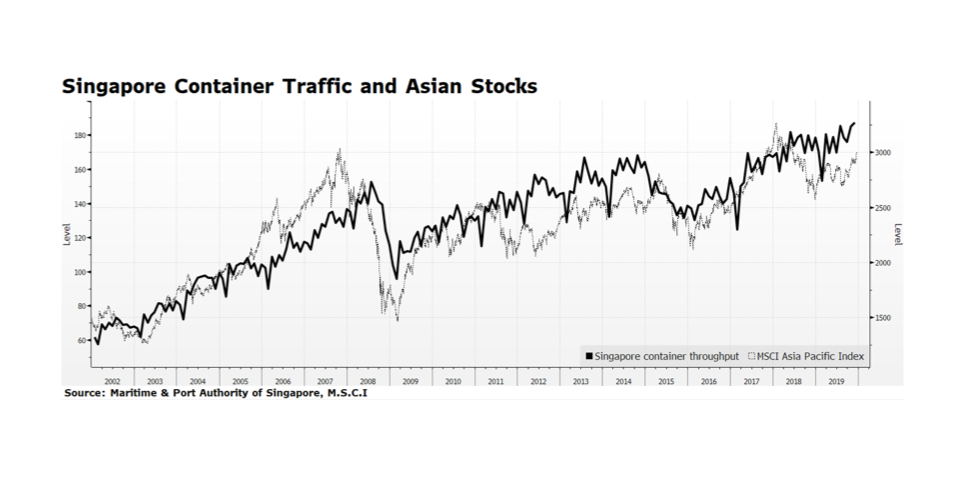
Trade flow in Asia is maintaining momentum after rebounding from the pandemic-caused low in February. Container traffic in Singapore has recently reached an all-time high level which many see as a proxy for trade in the region (or even the world) given its unique geographical location and distribution capacity. Improving economic trends in the region are also reflected in stock prices.  The MSCI Asia Pacific Index, which includes both developed and emerging equity markets, is leading global equities. The total return of the index is up 13.4% compared to the 9.5% return for FTSE All Cap Global Index so far this year through November 20, 2020. We view this as potentially a good omen for global equities because it may signal that the equity rally is broadening beyond the US. [data courtesy Maritime & Port Authority of Singapore, MSCI; chart courtesy Bloomberg LP © 2020]

WCM Chart of the Week for September 21, 2020

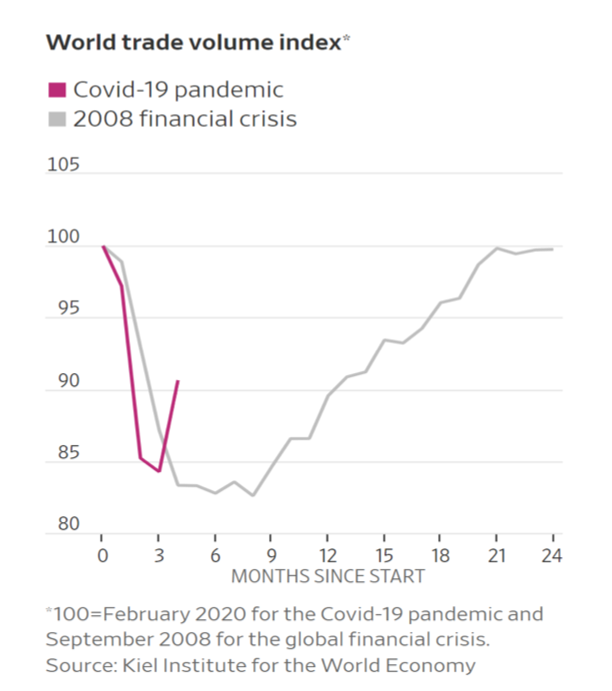
This week’s chart appeared in the Wall Street Journal via Germany’s Kiel Institute for the World Economy and shows the rapid rebound in global trade after the pandemic-induced economic stall.  As the Journal points out, World trade volume has regained half of the volume lost since the COVID-19 outbreak in three months whereas it took nearly 12 months for world trade to regain a similar drop in volume in the aftermath of the global financial crisis. While the rebound is not consistent across the globe, it is an encouraging sign that commerce is returning to normal.

What we find notable is the speed of the recovery in trade volume and consistency with our comments last week regarding the fast pace of US jobs re-creation. The causal nature of this recession was highly unusual, near universal global government-led economic lock-down, so it is not all that surprising that the recovery could be quicker than normal.  Several factors could disrupt the recovery including a potential second wave of viral infections, lack of an effective vaccine or therapeutics, and ongoing trade tensions.  But, improving macroeconomic trends are welcomed worldwide.