Category: Climate Justice

WCM Chart of the Week for April 4, 2022

With the release of “Climate Change 2022: Mitigation of climate change”, which is the third segment of this year’s sixth assessment report (AR6) from the IPCC, most of the attention will be focused again on the doomsday charts. One of the notable ones in the press packet is entitled “We are not on track to limit warming to 1.5 (deg) C.” But, the report is surprisingly optimistic in one very critical sense – it declares the problem addressable if global action is taken promptly and capital is called in off the sidelines to drive a transition in energy, land use, industry, urban zones, buildings and transportation that could halve GhG emissions by 2030. At this point the debate then usually swings to the nature of capitalist systems and that capital will flow to where it can be used most efficiently and to greatest effect (e.g. risk-adjusted return), and there it stops. Advocates for changing policy on climate will trot out the “if we don’t act we’ll all die and your money won’t mean anything” argument, having failed to learn that existential threats don’t tend to deter markets until they become existential realities, supporting a party-like-it’s-1999 mentality. However, one slide in the press packet which probably won’t get much attention actually holds the key to activating capital entitled “(In some cases) costs for renewables have fallen below those of fossil fuels.” This is profound in that it doesn’t require the rest of the science or policy or existential concerns to affect the flow of capital. It is simply becoming cheaper to convert today’s sunshine and wind into electricity and shove it into batteries than to dig up fossilized sunshine from more than 65 million years ago and burn it. Even with investment and innovation in efficiency, modern society will continue to be increasingly energy intensive, and as more of the world’s population joins the middle class, utilization will become even more widespread. Intelligent allocators of capital will pursue the cheaper inputs that will meet that demand.

The Doomsday Glacier — It’s Not a Bond Villain’s Plot. It’s Worse.

While many other things dominated the headlines from the Russian/Ukrainian conflict to inflation and policy response to COVID-19 Omicron part deux, something that was considered mostly unthinkable by scientists happened in Antarctica. According to the US National Ice Center (https://usicecenter.gov/PressRelease/IcebergC38):  “(USNIC) has confirmed that iceberg C-38… has calved from the Conger Ice Shelf in the Wilkes Land Region of Antarctica. As of March 17, C-38 was centered at 65° 40′ South and 102° 46′ East and measured 16 nautical miles on its longest axis and 10 nautical miles on its widest axis. C-38 comprised virtually all that remained of the Conger ice shelf, which was adjacent to the Glenzer Ice Shelf which calved last week as iceberg C-37.” Eyes had been on another part of Antarctica over concerns about the potential collapse of the so-called “Doomsday glacier” — Thwaite’s glacier. But, Conger beat Thwaite to the punch with a break-away described as nearly the size of Los Angeles. Our attached chart from NOAA NCEI chronicles the decline in global sea ice just since 1979. When split into hemispheres, Northern loss is faster at -2.68% vs. “only” -0.33% for Southern (decadal trend). The fact Conger collapsed and Thwaite’s is trying is deeply concerning because it illustrates just how fragile the system is. Failure to adjust climate-changing activities and to start building resiliency and adaptation into industries and communities poses real threats to economic stability and prosperity and the performance of investments over a shorter-term horizon than many expect.

Charting COP-26 — Is that a pie in the sky?

Today at COP-26 we received a declaration entitled “INTERNATIONAL AVIATION CLIMATE AMBITION COALITION”. Commercial aviation is a non-trivial contributor to GhG emissions. The widely cited statistic is that, if the industry were a nation, total output would rank it 7th after Germany. From a climate policy point of view though, we are asking whether the focus is correct on the part of policymakers and signatory nations. The International Civil Aviation Association (ICAO) already set goals a decade ago of improving efficiency by 2% per year, which was not out of line with historical trends. Improvements in jet engine efficiency along with innovations in avionics and lighter airframes have led to steady increases in efficiency per passenger seat for decades. It makes absolute commercial sense because of the amount of the economics of air transportation consumed by fuel costs. Each generation of aircraft upgrades provides significant improvements. Fuel burn for new aircraft fell by nearly half from 1968 to 2014. We are questioning the focus because unlike other industries like power generation, there are no viable alternatives on the visible horizon. Coal plants can be decommissioned in favor of natural gas, or going all the way to wind, solar, hydro, etc. ICE cars and trucks can be replaced with EVs. There is no EV plane (yet). The industry is doing its part in terms of innovation and of course there is room to do more. The real burden is behavioral though, and yet that is nowhere to be found in the COP statement. There are commitments to alternative fuels and technologies, but nothing about curbing unnecessary air travel, making more efficient aircraft affordable for developing nations rather than selling them hand-me-down decades-old aircraft, or changing the business mix to favor flying larger and more efficient airframes over the explosion in use of small, less efficient, commuter aircraft for many routes. [chart from International Council on Clean Transportation, Fuel Efficiency Trends for New Commercial Jet Aircraft: 1960 to 2014, Anastasia Kharina, Daniel Rutherford, Ph.D.]

Charting COP-26 and The Global (In)Action Agenda for Innovation in Agriculture, November 9, 2021

On November 6th, we got a clever hashtag mention — #climateshot – and a “Global Action Agenda”: Increase investment in agricultural research and innovation to create more climate-resilient, low-emission technologies and practices; Focus at least a third of agricultural research and innovation investments deliver demand-driven solutions across food systems, to protect nature and limit climate change; Showcase successful business models and promote public-private partnerships that deploy these innovations on the scale needed to meet the climate and food security challenge; Forge consensus on the evidence of what works, and facilitate inclusive dialogue among food and climate champions around the world. A lot of the right stakeholders (160 institutions, NGOs, countries and companies) are at the table, and there are four key initiatives: “The 100 Million Farmers Multi-Stakeholder Platform, led by the World Economic Forum. The Global Research Alliance on Agricultural Greenhouse Gases (GRA) initiative, which brings countries together to find ways to grow more food without growing greenhouse gas emissions. The new CGIAR organisational structure, research and innovation strategy and portfolio of initiatives. ClimateShot allies from the impact investment community comprise over 20 investors, funders and initiatives, including innovative funds aiming to mobilise over US$5 billion in financing to transform agriculture for people, nature and the climate.” And that is where it all falls down. 20 investors, funders and initiatives and $5 billion in capital is not going to transform anything. (Re)Learning from our world indigenous communities how to shift, or shift back, to regenerative agricultural practices has the potential to address a major carbon problem while also making significant strides in stewardship of water systems, all the while feeding the planet and providing economic opportunity to individuals, families, communities, companies and countries. It starts at the grassroots. This graphic, courtesy of Marc Barasch and Green World Ventures, is a hand illustration of a regenerative approach to smallholder farming already employed in Nigeria which at scale addresses a myriad of economic, nutritional and climatological challenges. What is old is very much new again, and requires activation of those 100 million farmers as well as activation of sufficient capital, from far more than 20 stakeholders, to catalyze a global change.

Charting COP-26 and the Path to Zero, November 5, 2021

Yesterday a consortium of mostly Anglo and European countries signed a statement affirming a commitment to “deliver sustainable, green and inclusive economic growth to meet the challenge of decarbonising our economies, in line with limiting the global average temperature increase to 1.5°C above the preindustrial levels.” The statement covers six categories of targets — Support for workers in the transition to new jobs, social dialogue and stakeholder engagement, economic strategies, local, inclusive, and decent work, supply chains, and Paris Agreement reporting. The important thing we note in this statement is the recognition of the necessity of public/private partnership. The path to zero requires industry and market-wide activation of capital and corporate infrastructure in the private sector and regulatory and reporting frameworks from the public sector that facilitate the private sector’s work. This chart from a May 2021 International Energy Agency (IEA) report “Net Zero by 2050: A Roadmap for Global Energy Sector” provides an excellent overview of the business and industry targets that must be met with the facilitation and support of both governments and NGOs over the next 30 years. The signatories to the statement make sense in that these are many of the wealthiest industrialized nations that have both the capital to pursue this agenda and a high degree of responsibility for having brought us to the climate precipice. However, the lack of presence from Australia, China and Japan is concerning as they must help lead among the community of nations as the most developed and prosperous (polluting) countries of the Asia-Pacific region.

Charting COP-26, Take 2, November 3, 2021

Jair Bolsonaro isn’t there either. While the President of Brazil is not in attendance, the country is still represented, but one is forced to wonder what the degree of commitment is when the boss chooses not to attend for “strategic” reasons. On the positive side of the ledger, even with Bolsonaro’s absence Brazil signed on to the pledge between 100 signatory countries to end deforestation by 2030. And reinforcing our point about the real action being with private enterprise and not with government, dozens of global financial services companies also are committing to discontinue investment in and financing for businesses and other concerns engaging in or profiting from deforestation. Today’s charts look at the trends and patterns in Amazonian deforestation. Brazil made great positive strides over the past decade dramatically improving over the prior twenty years. However, with Bolsonaro’s election we observe a significant jump in activity in 2019, and expect similar increases in 2020 and 2021 (not yet reflected in the data). The second chart from NASA provides a visual representation of reduction in vegetation in the Amazon in a period between 2000 and 2008 to illustrate the patterns of destruction. Ironically, note that the pattern looks like leaf veins, propagating from main roads to local roads and spreading out into the forest until larger and larger tracts of land are cleared. Crops like soy account for much of the native vegetation cleared, and one of the biggest importers of Brazilian soy in the last couple years is China. No Bolsonaro. No Xi. Starting to see a pattern there too? 

Charting COP-26, November 2, 2021

We will spend a bit of time in the coming days highlighting charts we think are material as they pertain to the finance aspects of the UN Conference of the Parties (COP-26) taking place in Glasgow. Our starting point for expectations on outcomes for COP-26 is low. There might be a few more reasons for optimism than there were going in to and coming out of the last convening that Sec. Gen. Guterres basically labeled a failure. But, with two linchpins in the global climate machinery – Russia and China – not present, even total agreement by the attending parties amounts to a half measure. More importantly, we do not believe the answer to the climate challenge resides in the hands of nation-states at the governmental level. As can be seen by these charts from the OECD on how many billions of dollars annually are deployed globally to address adaptation and mitigation across sectors, this is the proverbial small-barrel solution to a big-barrel problem. Many estimates rise into the trillions of dollars USD per year that must be mobilized in order to achieve the stated goal of avoiding the 1.5 degree scenario and address the adaptation and mitigation needs for climatological changes that are already established. That can only come from markets and industry, so the best possible action in Glasgow would be for governments to agree to create the conditions for private (and public) enterprise to succeed and thrive in building a better climate future and then get out of the way. [Charts from Climate Finance Provided and Mobilised by Developed Countries: Aggregate Trends Updated with 2019 data, OECD iLibrary]

WCM image of the week for September 21, 2021

Climate change imposes an indiscriminate tax on everyone. Increasing fire, flood, tornadoes, hurricanes, and coastal inundation are destroying private property and public infrastructure at an ever-increasing rate. But, there is no “they” to pay for it. We are they. And, it is not just the damage to places and things. There is a human cost in terms of lives and livelihoods, but also in the labor of countless emergency service workers, utility workers, etc. who go to work when a blaze needs to be battled or families need to be rescued from the roofs of their homes. People who do the brave work do not come cost-free. Even if they are volunteers they need resources to do their jobs. Looking locally, capital is being consumed in the tens, perhaps hundreds of billions of dollars here in the US not to create the next bridge, highway, dam or sewer, but to repair or replace what was already there. The cost of adaptation and resilience to climate change will accelerate away from us as well if the trajectory of change continues as it has. There is no path to higher global temperatures that does not include a tremendous economic burden falling on the backs of the global citizenry. We can pay the tax when the bill comes due, or we can seek out more capital-efficient ways to mitigate climate change and climate risk before it gets worse, including pricing that risk properly in the capital markets.

WCM Chart of the Week for August 18, 2021

The Intergovernmental Panel on Climate Change (IPCC) released the Working Group I contribution to the Sixth Assessment Report which will arrive fully in 2022. Among the reaffirmed findings in the report is that we are already most of the way to the 1.5 degree Celsius threshold over pre-industrial global temperatures where climate-related damage becomes more widespread and harder to turn back. We wanted to examine what that means in practical human terms. According to NOAA (R. Lindsey, Jan. 25, 2021), we have seen 8 – 9 inches of sea level rise since 1880, and in some ocean basins nearly that much just since the beginning of the satellite record. Taking the IPCC findings into account and with NOAA’s own models, sea level could rise another foot over 2000 levels by the end of the century. The two images provided are from NOAA’s Sea Level Rise Viewer. The first is a view of the heart of the Northeast Corridor from Long Island Sound down to the Chesapeake at the current “Mean Higher High Water”. The principal shading illustrates the population vulnerability to sea level rise. The second is the same view under a 1 foot MHHW scenario. Note the amount of coastal inundation, particularly around high density and vulnerable populations. The amount of property and population at risk in human and dollar terms is staggering in this relatively concentrated area, and has implications for municipalities, commercial real estate, infrastructure, corporations, maritime interests, tourism, and residential neighborhoods, and all the supply chains and institutions elsewhere like banks and insurance companies that are exposed to that risk. Smart investing requires thinking about mitigation, resiliency, and adaptation, hallmarks of ESG investing and increasingly becoming part of mainstream investing.

WCM ESG Week — Theme 5: Climate Justice

Climate change has pervasive and profound consequences for our planet, economies, and cultures. The systems of climate do not discriminate across racial lines, income levels, or geographical locations, nor abide by governmental policies and regulations. But it is important to draw a distinction between the worsening storms, sea level rise, drought, fire, ice loss and mass extinctions that occur on a planetary level, and the injustice of more prosperous businesses, communities, and nations driving that climate change and imperiling already marginalized communities at home and abroad. We lay witness to social, economic, public health, and environmental effects disproportionately impacting vulnerable and underprivileged populations. We acknowledge these inequalities of influence, largely on minority and low-income communities, as climate or environmental (in)justice.

Continued increases in global warming contribute to already existing challenges in eradicating poverty, reducing inequalities, and ensuring healthy individuals and ecosystems due to higher food insecurity and reduced water supply, community income losses, lost livelihood opportunities, adverse health impacts and population displacements, and increased competition for arable land. Poverty and disadvantage are projected to rise in some populations due to increased global warming. Some of the most severe impacts of climate change and a lack of climate resiliency are expected to be felt among agricultural and coastal dependent regions, indigenous people, children and the elderly, poor laborers and urban dwellers in African cities, and people and ecosystems in the Arctic and Small Island Developing States (SIDS), dryland regions, and least developed countries (IPCC, 2018).

For example, land degradation refers to the deterioration of soil quality due to both natural and anthropic impacts, accelerated during the 20th and 21st centuries as a result of increasing agricultural and livestock production, urbanization, deforestation, and extreme weather events such as droughts and coastal surges. Land degradation occurs over 25 percent of the Earth’s ice-free land area, affecting 1.3 to 3.2 billion people, the majority of whom are living in poverty in developing countries (IPCC). Land degradation and climate change, both independently and in conjunction, have severe consequences for natural resource-based regions including higher threats of malnutrition, increased risk of water and food borne diseases resulting from poor hygiene and lack of clean water, increased respiratory diseases due to atmospheric dust from wind erosion and air pollutants, and spread of infectious diseases as communities experience lack of food production and are forced to migrate to more hospitable regions (WHO, 2020).

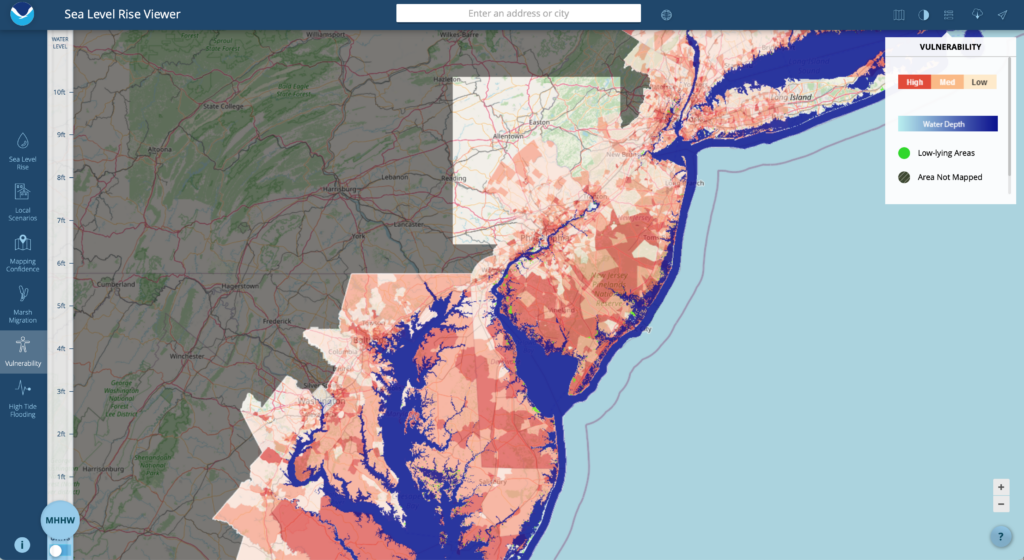
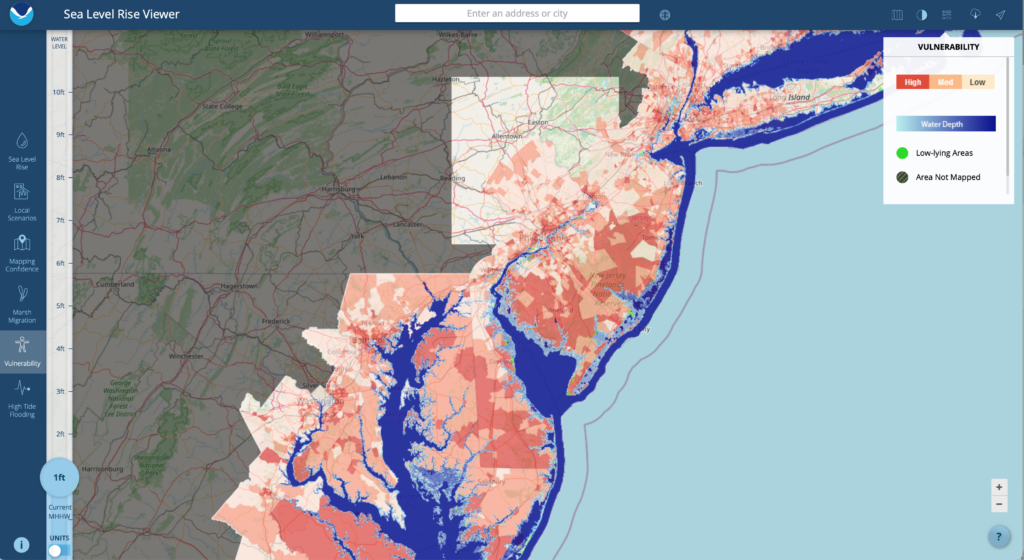
Furthermore, increasing global warming intensifies the exposure of small islands, low-lying coastal areas, and deltas to the hazards related to rising sea levels including increased saltwater intrusion, flooding and damage to infrastructure, loss of coastal resources, and a reduction in the productivity of fisheries and aquaculture. One global fishery model projected a decrease in global annual catch for marine fisheries of about 1.5 million tonnes for 1.5°C of global warming, with a loss of more than 3 million tonnes for 2°C of global warming. The risk of irreversible loss of many marine and coastal ecosystems escalates with global warming, specifically coral reefs which are projected to decline by a further 70–90% at 1.5°C and larger losses (>99%) at 2°C warming. Furthermore, changing ocean biochemistry due to increased acidification adversely affects marine species’ physiology, survivorship, habitat, reproduction, and disease incidence, and increases the risk of invasive species. Risks from vector-borne diseases, such as malaria and dengue fever, are projected to increase with warming in addition to potential shifts in their geographic range (IPCC, 2018).

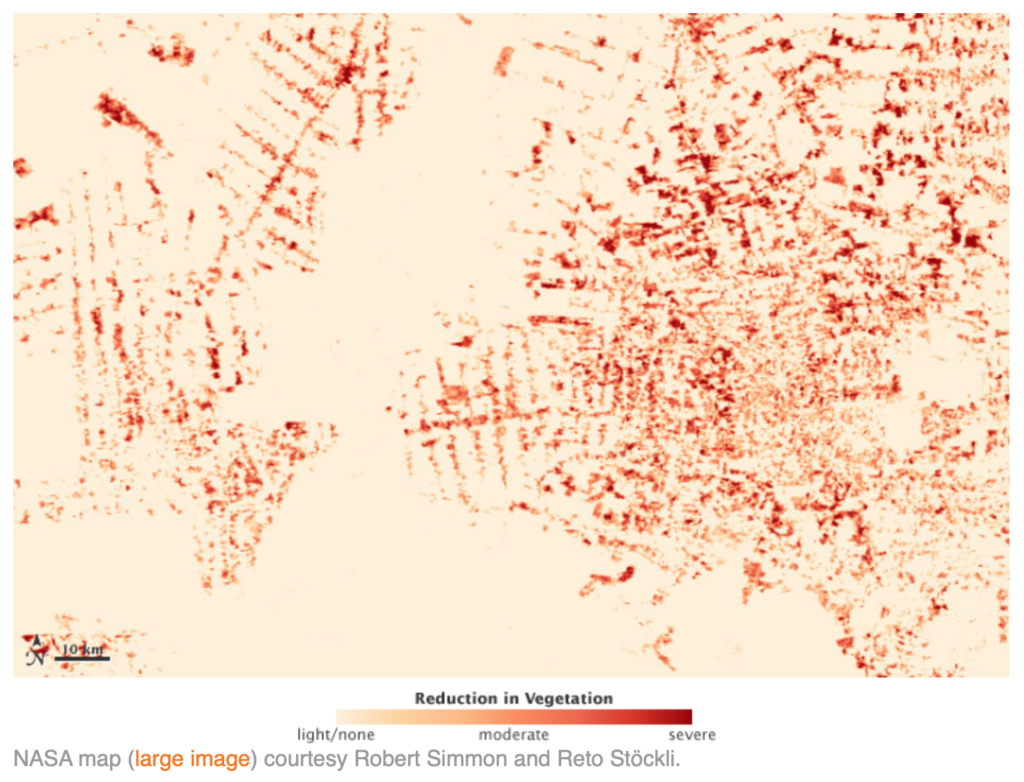
In addition to global warming and changing ecosystems, global industries also contribute to environmental injustice. Oil exploration and drilling fields have produced severe impacts on indigenous peoples and vulnerable communities around the world who depend on healthy ecosystems to survive. Oil drilling in the Amazon basin spurs deforestation of the land, introduces toxic pollutants impacting indigenous peoples’ health and wellness, and allows for hazardous working conditions for local employees. Incursions into indigenous lands are frequent and have been recorded in more than 20 communities in at least 10 countries including the United States, Australia, Bolivia, Brazil, Ecuador, and Peru (UN, 2021).

Closer to home, labor groups in Louisiana have reported dangerous working conditions in oil refineries, as they emit numerous types of toxic chemicals including benzene, formaldehyde, hydrogen sulfide, sulfur dioxide, and sulfuric acid. Oil production companies, although permitted to release these chemicals to the environment in designated amounts, are plagued with accidental spills and leaks often exceeding the allowable volumes. This toxic contamination puts nearby communities at high risk of environmental health problems. Additionally, in regions where fracking is used as a method to extract shale gas, such as Pennsylvania, surface and well waters are continually contaminated with the toxic chemicals used in fracking fluids and petrochemical run-off including salts, heavy metals, and radioactive chemicals. Oil pollution contaminates both drinking and agricultural water supplies for livestock and irrigation, which has been found to be particularly detrimental in the Melut Basin of South Sudan in Africa (UN, 2021).

Oil refineries and other chemical releasing facilities are predominantly surrounded by minority populations. Communities located in close proximity to such facilities, coined “fenceline communities”, are exposed to various kinds of toxic pollution, and in the U.S. are disproportionately composed of African Americans, Latinos, and low-income groups. The highest concentration of U.S. oil refineries is located in the Gulf of Mexico, with one of the most notable fenceline communities residing outside Houston, Texas. Three quarters of the city’s residents live within three miles of the 191 hazardous chemical facilities and are known to be at higher risk for heart disease, cancer, and respiratory problems related to poor air quality, such as asthma and emphysema. The combination of lack of access to healthy food, high poverty rates, and increased exposure to deadly contaminants makes for a serious problem in fenceline vulnerable communities, especially African Americans. Fenceline communities are found in many states across the U.S. as well as globally (UN, 2021).

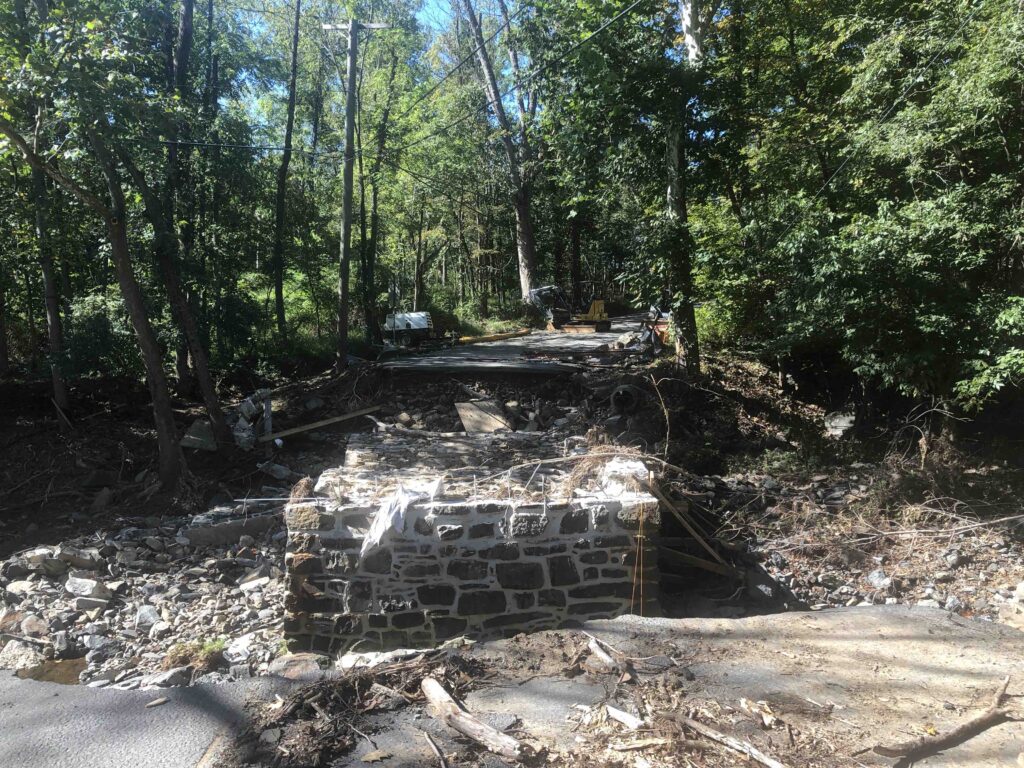
We have also observed a trebling effect with fenceline and other economically disadvantaged communities when climate change and environmental pollution collide. Storm surge, inundation, flood, and wind often cause this pollution to breach containment and further toxify neighborhoods and cities, waterways and water supplies, and farmable land as with Hurricane Katrina in 2005in Louisiana and Harvey and Imelda in 2017 and 2019 in Houston, TX. These types of climate-related disruptions cause communities to fracture as vulnerable people move to seek cleaner, safer, healthier, more sustaining situations. This destabilization can lead to diasporas, conflict and even war, as well as the disintegration of cultures and art. From port cities to open grasslands to the frozen tundra, the ability to be resilient and adaptive in the face of these environmental and climate forces requires access to capital and opportunity. Even better, developed economies taking their collective foot off the literal and figurative gas pedal will help to manage down the risk and give these at-risk communities a shot at better outcomes. Climate justice involves doing both. Less extractive and more regenerative. Systems that work on a global level for the benefit and welfare of all.

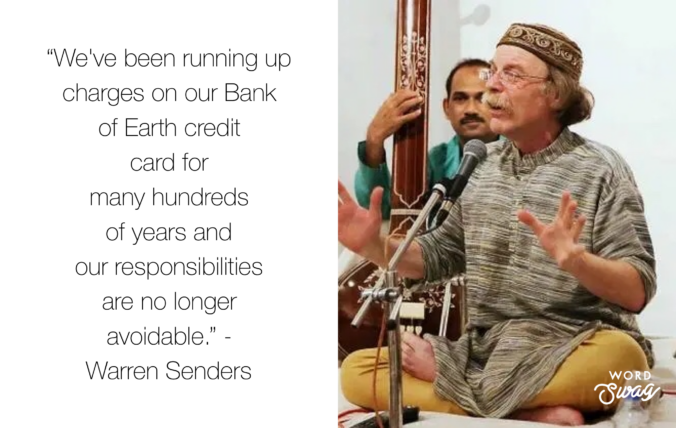
Climate justice gives us the words and concepts to frame and then address countless intertwined challenges that affect access to nutrition, access to clean water, access to education, access to economic opportunity, an expectation of peace and prosperity, and the ability and in fact the right to care for our collective legacy and culture and gift it to the generations that come after. Our final discussion for ESG Week is with Professor Warren Senders of the New England Conservatory of Music. We explore the interconnectedness of climate science, indigenous wisdom, and world art and culture, and our collective responsibility to care for the planet we have, and to care equitably and justly for the people on it.

https://www.who.int/news-room/q-a-detail/climate-change-land-degradation-and-desertification

https://www.ipcc.ch/site/assets/uploads/sites/2/2019/06/SR15_Full_Report_High_Res.pdf

https://wedocs.unep.org/xmlui/bitstream/handle/20.500.11822/35417/EJIPP.pdf