Category: Environment (Page 2 of 3)

WCM ESG Week — Theme 3: Medical Justice and Access to Healthcare

In 2021 when we think of justice we may think of our court system, the disproportionately high incarceration rates of African Americans and Hispanics, inequalities of pay for women vs men, or a significant lack of funding for minority-owned small businesses amongst financial institutions and investment funds. One theme that may not be at the forefront of our word association is medical or healthcare justice, which refers to the opportunity for all to live a healthful life and access equitable and affordable quality care when it is needed.

In 2015 the United Nations launched the 2030 Agenda for Sustainable Development; a plan of action to address universal peace and prosperity for people and the planet by 2030. In it, the United Nations outlined 17 Sustainable Development Goals to address and measure progress on our world’s most pressing issues threatening a healthy and prosperous future. Goal 3, “ensure healthy lives and promote well-being for all at all ages” outlines 13 healthcare targets for equitable global health including reducing maternal mortality rates and ending the epidemics of AIDS, tuberculosis, malaria, etc. (UN SDG, 2015). For a large percentage of the population in the United States, healthcare is an assurance provided by parents, universities, employers or government programs.

However, a study conducted by the Commonwealth Fund in 2020 found that 43.4% of adults aged 19 – 64 were inadequately insured; 9.5% were insured but had a gap in coverage within the last year, 21.3% were fully insured, however out-of-pocket or deductible costs were so high relative to annual income they were considered underinsured, and 12.5% were completely uninsured. Inadequate healthcare coverage exposes individuals and families to high health care costs which often accumulate into medical debt. Among those who reported a medical bill or debt problem, 37% said they had used all of their savings to pay their bills, 40% received a lower credit rating as a result of their medical debt, 31% were forced to transfer medical debt to their credit cards, and one-quarter were unable to pay for basic necessities such as food, heat, or rent (Commonwealth Fund, 2020). 

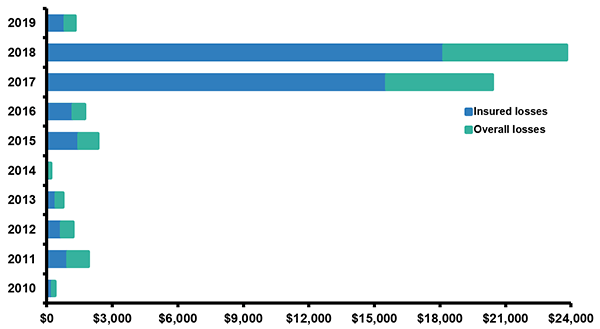
When we consider health and wellness on a global scale, we must consider all the variables that comprise good health including access to quality nutrition, clean water, sanitation facilities and supplies, basic medical services, and education for disease prevention and treatment. 36% of the world’s population, roughly 2.5 billion people, lack access to improved sanitation facilities, putting them at risk of several preventable diseases including dysentery, cholera, and typhoid (WHO, 2015). Furthermore, nutrition-related factors contribute to approximately 45% of deaths in children 5 years and under. Malnourished children have a higher risk of death from common childhood illnesses such as pneumonia and malaria. Children in sub-Saharan Africa are more than 15 times more likely to die before the age of five than children in high income countries. In addition, 94% of all maternal deaths occur in low and lower middle-income countries. In 2017 alone, 810 women died each day from preventable causes related to pregnancy and childbirth (UN SDG, 2021).  Focusing on what is just in terms of access to basic needs but also access to a clean, safe environment and workplace improves overall wellness and with it productivity and prosperity while reducing the social and economic burdens that come with unwell communities.

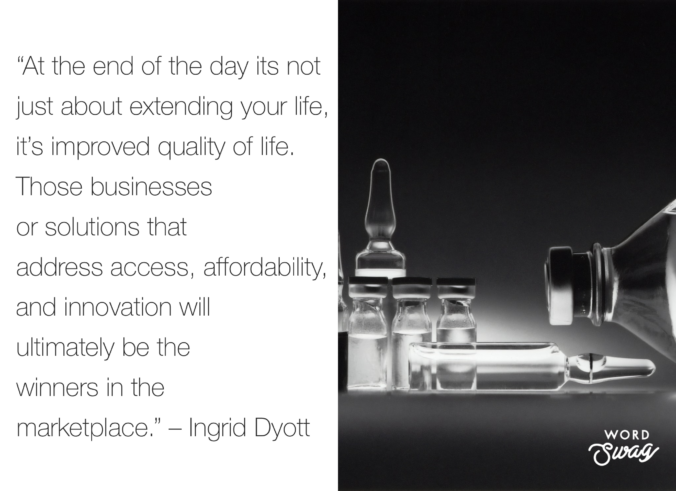
Tune into our Wilde Capital Management ESG Week podcast 3: Medical Justice and Access to Healthcare where we discuss the structural challenges to achieving a global basic level of wellness, and how companies both in and out of the broad medical industrial complex can contribute to achieving greater global health with Ingrid Dyott, Managing Director and Portfolio Manager at Neuberger Berman.

https://www.un.org/sustainabledevelopment/health/

https://www.commonwealthfund.org/publications/issue-briefs/2020/aug/looming-crisis-health-coverage-2020-biennial

https://www.who.int/publications/i/item/9789241564977

WCM ESG Week — Theme 1: Regenerative Agriculture

Between 21–37% of all greenhouse gas (GHG) emissions are attributable to our global food system, from agriculture and land use, storage, transport, packaging, processing, retail, and consumption. As increased GHG levels further accelerate climate change, warming over land is occurring at a rate faster than the global average, with observable impacts on the land system. Traditional agricultural practices and arable land misuse have contributed to the degradation of roughly 75% of the Earth’s land area.

In addition to land degradation, the European Commission Joint Research Centre estimates 36 billion tons of soil is lost every year (Moyer, 2020). Depletion of soil nutrients, due to various natural and anthropogenic activities, affects people and ecosystems throughout the planet, and is both influenced by climate change and contributes to it. Warmer temperatures and changing precipitation patterns alter the beginning and end of growing seasons, contribute to regional crop yield reductions, reduce freshwater availability, and push biodiversity toward an unforgiving cliff (IPCC, 2019).

Recent studies indicate we are facing a biodiversity catastrophe, with 1,000,000 species at significant risk of extinction due to the climate crisis and habitat loss (Moyer, 2020). The frequency and intensity of extreme weather and climate events have also increased due to global warming and will continue to increase under medium and high emission scenarios (IPCC, 2019).

That is not to say that all hope is lost. Amid an abundance of dismal facts and figures, our species maintains both the responsibility and the capacity to discontinue extractive and degrading land use practices and implement large scale restorative and sustainable processes. Regenerative agriculture is a systems approach to farming that builds soil health by supporting biodiversity to return carbon and nutrients back to the soil. It is a holistic land use practice that can involve diversifying crop rotations, planting cover crops, green manures and perennials, retaining crop residues, using natural sources of fertilizer such as compost, employing highly managed grazing and/or integrating crops and livestock, reducing tillage frequency and depth, and eliminating synthetic chemicals (Moyer, 2020). Agro-ecology systems (systems that incorporate natural ecological processes with agricultural production) have many rewards to society, including increases in local income and nutrition, as well as a drawdown of CO₂ back into the soil (Chainlink, 2021). Regenerative agriculture focuses not only on reducing the carbon footprint and ensuring sustainability, but also on going beyond conventional practices to reverse the effects and progression of climate change. Indigenous and local ecological knowledge often contribute to the development of restorative agricultural practices and can enhance resilience against climate change and reduce land misuse (Moyer, 2020).

Tune into our Wilde Capital Management ESG Week podcast: Day 1 – Regenerative Agriculture to learn more. In this interview with Marc Ian Barasch, author and filmmaker, we discuss the ideas behind applying regenerative principles to the business of agriculture, providing for greater abundance for a population of nearly 8 billion people, caring for climate, water, and other systems that are failing as we speak.

https://www.ipcc.ch/site/assets/uploads/sites/4/2020/07/03_Technical-Summary-TS_V2.pdf

https://rodaleinstitute.org/wp-content/uploads/Rodale-Soil-Carbon-White-Paper_v11-compressed.pdf

https://blog.chain.link/reversing-climate-change-how-hybrid-smart-contracts-incentivize-regenerative-agriculture/

WCM Chart of the Week for June 8, 2021 — UN World Oceans Day

We held this week’s chart until today to coincide with UN World Oceans Day, which lines up well with SDG 14 Life Below Water as well as several other SDGs relating to climate, food and waste. The chart comes from the Food and Agriculture Organization of the UN’s 3rd assessment of global marine fisheries discards (2019), illustrating the thousands of metric kilotonnes of discard by ocean region. Although with a variety of supervisory regimes and certifications and consumer scrutiny the amount of discard and bycatch in commercial fishing is believed to be on the decline, the reality is that the overall annual volume is still alarmingly high. From bottom-feeders to apex predators, the incidental injury to or death of sea animals is not only cruel, it risks destabilizing a critical part of the global food system for humans and irreversibly disrupting an essential part of the global climate system. Consumers and companies can and should continue to exert pressure on seafood businesses to improve the sustainability of their supply chains because it is good for people, planet AND profit. #worldoceansday #bycatch #SDG14

WCM Chart of the Week for June 1, 2021

On Monday, China’s Politburo, the CCP’s top decision-making body, announced that all married couples could have up to three children along with expanded government support for child rearing and education. It is widely speculated that this is driven by deteriorating demographics in China. In this week’s chart we observe the continued and accelerating upward trend in the 65+ age group versus China’s total population. The Wall Street Journal reported that the prime working age population (citizens between the ages of 15 and 59) has declined from 70.1% in 2010 to 63.35% in 2020. Age distribution is critical to economic vitality and notoriously difficult to alter and in China, the one child policy that was lifted in 2016 may have created a new norm because it lasted so long. The effect may be a permanently lowered replacement rate. We can’t help but find it ironic that the directive comes from the Politburo which is dominated by 60+ year old men (we could only find one female on its current roster). Another significant point that Peter Orszag, a widely respected former Washington budget official, notes in his Bloomberg opinion piece of May 11th, a declining Chinese population could mean lower carbon emissions, which is material since China’s total carbon footprint exceeds that of the entire OECD combined (27% of global GhGs). [chart courtesy Bloomberg LP © 2021]

The clock is ticking. What does that mean for investors?

Another trip around the sun leading to another Earth Day, our second of the pandemic. Amid all the trauma, last year we got a brief glimpse of what hitting the pause button on our use and overuse of the planet would yield. Fresher air, cleaner water, wildlife in the canals and in the streets. We conducted an unintended (and unwanted), all-in global experiment, and graphically demonstrated that the environment does have the capacity to respond to behavioral change on the part of humans.

Stopping everything isn’t the answer. But changing everything could be. This planetary test case provided strong evidence against the argument that global systems are too vast and too complex, and changing human patterns wouldn’t result in any sort of improvement. A change from extractive to regenerative processes in food, energy, materials, housing, and transportation among others not only can help address the challenge of sufficiency but also manage our footprint so we live with rather than just on Earth. There is still time to stop and possibly even partially reverse the mounting damage to atmospheric, oceanic, littoral, arborial and other global systems. The risk of not taking those steps is existential for humanity, and it is also bad capitalism. Wildfire, inundation, desertification, loss of pollinators, extreme weather, even glacial collapse have real economic consequences from interrupting supply chains to destroying value in the billions and trillions of dollars.

Moving to more regenerative businesses and communities will mitigate or even prevent some of these risks from manifesting, and will be more equitable and inclusive and result in more financial opportunity for individuals and entire markets. The best possible investment is one that both reduces risk and catalyzes growth at the same time. Caring for the planet we live with is also the best possible free option to get on that trade.

#TurtleIsland

WCM Chart of the Week for February 8, 2021

What does a pledge from China of carbon neutrality by the year 2060 actually mean, and how do we measure progress? There are various global targets for climate change mitigation that attempt to quantify what needs to be done so that the global system does not exceed the point of no return, generally seen as a rise of 1.5 – 2.0 degrees Celsius. Under the Paris climate accord, a number of nations committed to carbon neutrality in the next 30 years. China said 40, but as the largest economy on Earth how do we measure their progress? This week’s chart from the US Energy Information Administration country analysis of China (Sept. 2020) is just one hint at the structural challenges China faces in achieving the target. On a per-capita basis China’s carbon footprint is still smaller than the developed West, but their total footprint is more than a quarter of the world’s total output, and their energy mix is just 15% non-carbon and more than half coal. After the pandemic interruption that marked the period around the Lunar New Year, China’s carbon output returned to or even exceeded pre-pandemic levels. We are looking for the steps China will take now to level out carbon growth so that it can begin reversing the trend after 2030, and wonder, even worry whether another 10 years of increasing output takes us past the global point of no return.

Pine beetles and self-reinforcing climate consequences

Beetle Kill in Colorado (c) 2020 J. Sorgi

By September of this past year, both California and Colorado had experienced record-breaking wildfires, exceeding previous history for the largest wildfires in their respective states. According to the National Interagency Fire Center, more than 7.5 million acres had burned across the United States by Fall 2020, surpassing the approximate 6.1 million acre 10-year annual average (NIFC, 2020). Why have we seen increasingly disastrous wildfires in recent years?

Enter stage right the mountain pine beetle. Approximately 5 mm in length with an average life span of one year, the mountain pine beetle may not seem like a formidable opponent, but like all ecosystems, each member is densely interconnected (USDA FS, 2011). An imbalance of one species always equates to consequences for another.

One of 17 species of bark beetles native to North America, the mountain pine is a wood-boring insect that has shaped the forest landscapes from Canada to Mexico for thousands of years (NPS, 2018). From July to August, adult pine beetles colonize forests in search of larger trees (typically no less than 3 inches in diameter). Affected pine species include Lodgepole, Ponderosa, Western White, Whitebark, Jack, and Limber pine. Once a suitable host has been identified, female beetles excrete a pheromone signaling other beetles to follow (Katz, 2017). Females then begin eating tunnels called galleries into the inner bark of the tree, extending up to 30 inches or more from the attack site. The eggs hatch and beetle larvae continue burrowing and feeding until winter freezing temperatures trigger dormancy. By June or early July, larvae pupate and emerge from the tree in search of new hosts to repeat the cycle. Within one year of invasion, infested trees can fade from green to red-brown and die (USDA FS, 2011).

Continue reading

WCM Chart of the Week for February 2, 2021

It is not surprising that China’s carbon emissions are growing given relatively strong economic activity compared to the developed world. Or perhaps it is given China’s pledge of carbon neutrality by the year 2060. China’s contribution to carbon in our atmosphere is approaching 10 billion tons annually, an amount that is greater than the US and Europe combined. To place that in context, according to the World Bank, as of 2019 the Chinese economy is only 38.6% of US and EU economic output. It is important to note that carbon output in the US and Europe has been steady and even declining as their economies are expanding. Another startling fact is the Chinese economy represents 16.3% of Global GDP (also World Bank data) and yet contributes nearly 29% of the 34.2 billion tons of carbon emissions, according to the British Petroleum Statistical Review. In our view, China has a great deal to do to meet its 2060 carbon neutrality pledge on its way to becoming the world’s largest economy, starting with action on its COP21 Paris commitments including reducing its dependence on coal.  [chart courtesy British Petroleum Statistical Review, © 2021]

WCM Chart of the Week for October 19, 2020

Wildfire has had profound implications both for and because of climate change, for ecosystems, for communities, and for public health and safety. Wildfire has also had major economic consequences. Loss of housing, loss of commercial space, loss of public infrastructure, loss of crops, and loss of tourist revenue all add up to tens of billions of dollars a year just in the United States. The risk of wildfire conspiring with a lack of adequate governance and safety practices led to devastating financial losses and convictions on 84 counts of manslaughter for one of the largest utilities in the country. This week’s chart is from Munich Re and NatCatSERVICE by way of the Insurance Information Institute showing wildfire losses over the last decade (expressed in millions). Note that the spike in 2017 was so significant that the data from prior years is swamped by scale. While 2019 appears to have been a more modest loss year on par with earlier in the decade, according to the National Interagency Fire Center (nifc.gov) as of October 19th this year nearly twice as many acres have burned as by the 19th of last year, on pace with 2018 and 2019. The tale has yet to be written but that would suggest another likely spike in insured and uninsured losses. Economic loss is as much about the incidence of wildfire as it is the private encroachment on wild spaces. People increasingly work, farm and live in vulnerable forested and grassed spaces based on a history of relative fire scarcity that no longer exists. Without addressing both the climate systems issues to mitigate fire risk, and the resiliency of communities and businesses in the face of more frequent and prevalent fire, economic losses will continue to climb.

UN 75th, Oceans and Climate

“Global warming: the long-term heating of Earth’s climate system… due to human activities, primarily the burning of fossil fuels, which increases heat-trapping greenhouse gas levels in Earth’s atmosphere,” (Shaftel, 2020). The term coined decades ago has gained momentum in not only scientific communities and environmental organizations, but political campaigns and industry corporate governance policies around the globe. From polar ice melting and sea levels rising to extreme weather events, our changing climate has far reaching and compounding effects on the environment and ecosystems, our economies and industries, and our global food supply. One of the direct effects of climate change and global warming is ocean acidification.

To examine the process of ocean acidification and its impacts on human life, recall an adolescent science lesson on pH and water chemistry. The pH scale runs from 0-14, with 7 being neutral. Higher than 7 represents a basic or “alkaline” pH and lower than 7 represents an acidic concentration. For reference, household vinegar, an acidic liquid, has an average pH of 2.5, while tap water has an average pH of 7.5. The ocean’s current pH is approximately 8.1, which is basic (NOAA, 2020). How does the ocean’s pH tie into global warming and climate change?

The ocean naturally absorbs roughly 30% of the carbon dioxide that is released into the atmosphere.  When seawater and carbon dioxide combine, carbonic acid is produced, lowering the pH of the ocean and increasing the acidity. As levels of carbon dioxide increase due to human activity (burning of fossil fuels, land-use change and deforestation, agricultural industries) the amount of CO2 absorbed by the ocean also increases. Plainly speaking, the more CO2 we produce and release into the atmosphere, the more acidic our oceans become. Since the Industrial Revolution in the 1700’s, increases in CO2 have resulted in a 30% increase in ocean acidity (NOAA, 2020). This present acidification process is occurring ten times faster than any previous changes over the last 300 million years (IUCN, 2017). The rapid acceleration of CO2 production significantly jeopardizes the ability of ecosystems to effectively adapt to the changes in ocean chemistry.

Increased ocean acidity especially affects organisms with calcium carbonate shells or skeletons including shellfish like coral, oysters, crab, and lobster. A recent study performed by the National Oceanic and Atmospheric Administration on the pteropod, a small sea snail integral to the ocean food chain, showed that the levels of ocean pH projected for year 2100 dissolve the organism’s shell within just 45 days. Furthermore, researchers have already discovered severe shell dissolution in pteropods naturally found in the Southern (Antarctic) Ocean, indicating the process’ rapid progression (NOAA, 2020). The pteropod snail is a major food source affecting members of the food chain from krill and fish to whales and seals. When we consider how each organism is interconnected in the food web, the loss of one species creates a cascading effect. 

Unfortunately, the consequences do not stop there. Increased acidity has also been linked to a disturbance in scent transmission, inhibiting species from detecting predators and locating suitable habitats (NOAA, 2020). Acidification has also been observed to affect sound transmission, reducing sound absorption and increasing the ocean’s ambient noise (OAN). Increases in OAN can impair marine animals’ hearing and communication, increase stress and lower their immune systems, and even cause brain hemorrhaging or death in severe cases (Gazioğlu, 2015).

High Level Impacts

In 2018, the global fishing and seafood sector represented a USD 164 billion international trade industry employing 59.5 million people. 88% of the 179 billion tonnes of total fish produced in 2018 was for direct human consumption. Fish and fish products supply approximately 3.3 billion people with nearly 20 percent of their average per capita intake of animal protein. Furthermore, seafood provides many crucial nutrients to the human diet including long chain Omega-3 fats, iodine, vitamin D, iron, calcium, zinc, and other minerals. With key species like the pteropod in jeopardy, the entire seafood industry risks significant threat, exacerbating global hunger and malnutrition (FOA, 2020). Dying coral systems lack the ability to effectively buffer coastal communities from storm waves and erosion, and leave those communities to suffer consequences to tourism and commercial business (IUCN, 2017). Profits, careers, economies, biodiversity, ecosystem structure, shoreline integrity, and global food supply are all threatened if ocean acidification continues to accelerate due to increased CO2 production.

As managers of sustainable and responsible investment portfolios, our passion lies not only in providing ethically sourced returns for our clients, but in supporting positive impact-driven companies and communities. Conscious investing is achieved through selective avoidance of institutions that harm ecosystems or using the allocation of capital as a lever to change those institutions, in conjunction with focusing on institutions that provide regenerative and resourceful solutions to humanities’ needs.

Sources

Food and Agriculture Organization of the United Nations. (2020). The State of World Fisheries and Aquaculture 2020. Www.Fao.Org. http://www.fao.org/state-of-fisheries-aquaculture

Gazioğlu, C., Müftüoğlu, A. E., Demir, V., Aksu, A., & Okutan, V. (2015). Connection between Ocean Acidification and Sound Propagation. International Journal of Environment and Geoinformatics2(2), 16–26. https://doi.org/10.30897/ijegeo.303538

International Union for Conservation of Nature. (2017, November). Ocean acidification. IUCN. https://www.iucn.org/resources/issues-briefs/ocean-acidification

National Oceanic and Atmospheric Administration. (2020, April). Ocean Acidification. https://www.noaa.gov/education/resource-collections/oceans-coasts/ocean-acidification

Shaftel, H. (2020, September). Overview: Weather, Global Warming and Climate Change. Climate Change: Vital Signs of the Planet. https://climate.nasa.gov/resources/global-warming-vs-climate-change/

« Older posts Newer posts »