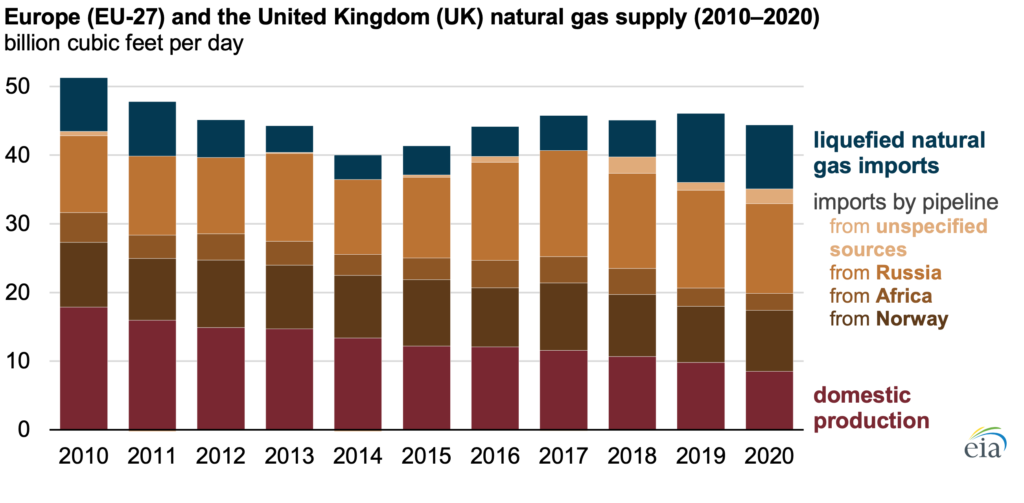
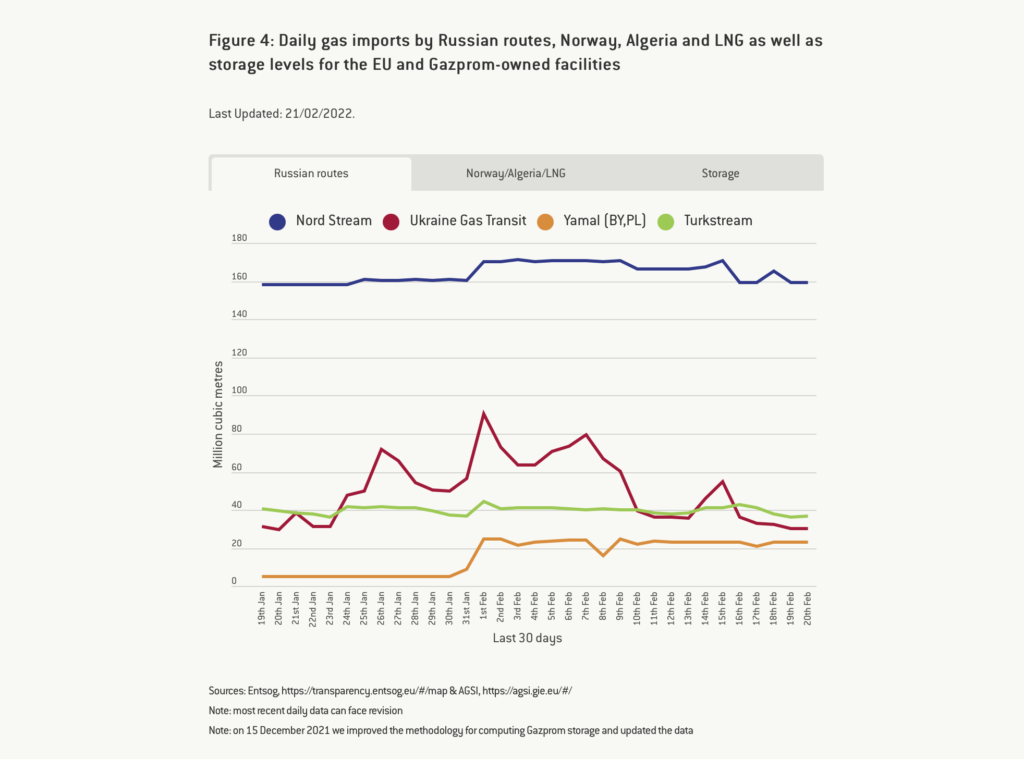
Author: Mark Sloss (Page 2 of 10)

Charting COP-26 — Is that a pie in the sky?

Today at COP-26 we received a declaration entitled “INTERNATIONAL AVIATION CLIMATE AMBITION COALITION”. Commercial aviation is a non-trivial contributor to GhG emissions. The widely cited statistic is that, if the industry were a nation, total output would rank it 7th after Germany. From a climate policy point of view though, we are asking whether the focus is correct on the part of policymakers and signatory nations. The International Civil Aviation Association (ICAO) already set goals a decade ago of improving efficiency by 2% per year, which was not out of line with historical trends. Improvements in jet engine efficiency along with innovations in avionics and lighter airframes have led to steady increases in efficiency per passenger seat for decades. It makes absolute commercial sense because of the amount of the economics of air transportation consumed by fuel costs. Each generation of aircraft upgrades provides significant improvements. Fuel burn for new aircraft fell by nearly half from 1968 to 2014. We are questioning the focus because unlike other industries like power generation, there are no viable alternatives on the visible horizon. Coal plants can be decommissioned in favor of natural gas, or going all the way to wind, solar, hydro, etc. ICE cars and trucks can be replaced with EVs. There is no EV plane (yet). The industry is doing its part in terms of innovation and of course there is room to do more. The real burden is behavioral though, and yet that is nowhere to be found in the COP statement. There are commitments to alternative fuels and technologies, but nothing about curbing unnecessary air travel, making more efficient aircraft affordable for developing nations rather than selling them hand-me-down decades-old aircraft, or changing the business mix to favor flying larger and more efficient airframes over the explosion in use of small, less efficient, commuter aircraft for many routes. [chart from International Council on Clean Transportation, Fuel Efficiency Trends for New Commercial Jet Aircraft: 1960 to 2014, Anastasia Kharina, Daniel Rutherford, Ph.D.]

Charting COP-26 and The Global (In)Action Agenda for Innovation in Agriculture, November 9, 2021

On November 6th, we got a clever hashtag mention — #climateshot – and a “Global Action Agenda”: Increase investment in agricultural research and innovation to create more climate-resilient, low-emission technologies and practices; Focus at least a third of agricultural research and innovation investments deliver demand-driven solutions across food systems, to protect nature and limit climate change; Showcase successful business models and promote public-private partnerships that deploy these innovations on the scale needed to meet the climate and food security challenge; Forge consensus on the evidence of what works, and facilitate inclusive dialogue among food and climate champions around the world. A lot of the right stakeholders (160 institutions, NGOs, countries and companies) are at the table, and there are four key initiatives: “The 100 Million Farmers Multi-Stakeholder Platform, led by the World Economic Forum. The Global Research Alliance on Agricultural Greenhouse Gases (GRA) initiative, which brings countries together to find ways to grow more food without growing greenhouse gas emissions. The new CGIAR organisational structure, research and innovation strategy and portfolio of initiatives. ClimateShot allies from the impact investment community comprise over 20 investors, funders and initiatives, including innovative funds aiming to mobilise over US$5 billion in financing to transform agriculture for people, nature and the climate.” And that is where it all falls down. 20 investors, funders and initiatives and $5 billion in capital is not going to transform anything. (Re)Learning from our world indigenous communities how to shift, or shift back, to regenerative agricultural practices has the potential to address a major carbon problem while also making significant strides in stewardship of water systems, all the while feeding the planet and providing economic opportunity to individuals, families, communities, companies and countries. It starts at the grassroots. This graphic, courtesy of Marc Barasch and Green World Ventures, is a hand illustration of a regenerative approach to smallholder farming already employed in Nigeria which at scale addresses a myriad of economic, nutritional and climatological challenges. What is old is very much new again, and requires activation of those 100 million farmers as well as activation of sufficient capital, from far more than 20 stakeholders, to catalyze a global change.

Charting COP-26 and the Path to Zero, November 5, 2021

Yesterday a consortium of mostly Anglo and European countries signed a statement affirming a commitment to “deliver sustainable, green and inclusive economic growth to meet the challenge of decarbonising our economies, in line with limiting the global average temperature increase to 1.5°C above the preindustrial levels.” The statement covers six categories of targets — Support for workers in the transition to new jobs, social dialogue and stakeholder engagement, economic strategies, local, inclusive, and decent work, supply chains, and Paris Agreement reporting. The important thing we note in this statement is the recognition of the necessity of public/private partnership. The path to zero requires industry and market-wide activation of capital and corporate infrastructure in the private sector and regulatory and reporting frameworks from the public sector that facilitate the private sector’s work. This chart from a May 2021 International Energy Agency (IEA) report “Net Zero by 2050: A Roadmap for Global Energy Sector” provides an excellent overview of the business and industry targets that must be met with the facilitation and support of both governments and NGOs over the next 30 years. The signatories to the statement make sense in that these are many of the wealthiest industrialized nations that have both the capital to pursue this agenda and a high degree of responsibility for having brought us to the climate precipice. However, the lack of presence from Australia, China and Japan is concerning as they must help lead among the community of nations as the most developed and prosperous (polluting) countries of the Asia-Pacific region.

Charting COP-26, Take 2, November 3, 2021

Jair Bolsonaro isn’t there either. While the President of Brazil is not in attendance, the country is still represented, but one is forced to wonder what the degree of commitment is when the boss chooses not to attend for “strategic” reasons. On the positive side of the ledger, even with Bolsonaro’s absence Brazil signed on to the pledge between 100 signatory countries to end deforestation by 2030. And reinforcing our point about the real action being with private enterprise and not with government, dozens of global financial services companies also are committing to discontinue investment in and financing for businesses and other concerns engaging in or profiting from deforestation. Today’s charts look at the trends and patterns in Amazonian deforestation. Brazil made great positive strides over the past decade dramatically improving over the prior twenty years. However, with Bolsonaro’s election we observe a significant jump in activity in 2019, and expect similar increases in 2020 and 2021 (not yet reflected in the data). The second chart from NASA provides a visual representation of reduction in vegetation in the Amazon in a period between 2000 and 2008 to illustrate the patterns of destruction. Ironically, note that the pattern looks like leaf veins, propagating from main roads to local roads and spreading out into the forest until larger and larger tracts of land are cleared. Crops like soy account for much of the native vegetation cleared, and one of the biggest importers of Brazilian soy in the last couple years is China. No Bolsonaro. No Xi. Starting to see a pattern there too? 

Charting COP-26, November 2, 2021

We will spend a bit of time in the coming days highlighting charts we think are material as they pertain to the finance aspects of the UN Conference of the Parties (COP-26) taking place in Glasgow. Our starting point for expectations on outcomes for COP-26 is low. There might be a few more reasons for optimism than there were going in to and coming out of the last convening that Sec. Gen. Guterres basically labeled a failure. But, with two linchpins in the global climate machinery – Russia and China – not present, even total agreement by the attending parties amounts to a half measure. More importantly, we do not believe the answer to the climate challenge resides in the hands of nation-states at the governmental level. As can be seen by these charts from the OECD on how many billions of dollars annually are deployed globally to address adaptation and mitigation across sectors, this is the proverbial small-barrel solution to a big-barrel problem. Many estimates rise into the trillions of dollars USD per year that must be mobilized in order to achieve the stated goal of avoiding the 1.5 degree scenario and address the adaptation and mitigation needs for climatological changes that are already established. That can only come from markets and industry, so the best possible action in Glasgow would be for governments to agree to create the conditions for private (and public) enterprise to succeed and thrive in building a better climate future and then get out of the way. [Charts from Climate Finance Provided and Mobilised by Developed Countries: Aggregate Trends Updated with 2019 data, OECD iLibrary]

WCM image of the week for September 21, 2021

Climate change imposes an indiscriminate tax on everyone. Increasing fire, flood, tornadoes, hurricanes, and coastal inundation are destroying private property and public infrastructure at an ever-increasing rate. But, there is no “they” to pay for it. We are they. And, it is not just the damage to places and things. There is a human cost in terms of lives and livelihoods, but also in the labor of countless emergency service workers, utility workers, etc. who go to work when a blaze needs to be battled or families need to be rescued from the roofs of their homes. People who do the brave work do not come cost-free. Even if they are volunteers they need resources to do their jobs. Looking locally, capital is being consumed in the tens, perhaps hundreds of billions of dollars here in the US not to create the next bridge, highway, dam or sewer, but to repair or replace what was already there. The cost of adaptation and resilience to climate change will accelerate away from us as well if the trajectory of change continues as it has. There is no path to higher global temperatures that does not include a tremendous economic burden falling on the backs of the global citizenry. We can pay the tax when the bill comes due, or we can seek out more capital-efficient ways to mitigate climate change and climate risk before it gets worse, including pricing that risk properly in the capital markets.

WCM Chart of the Week for August 18, 2021

The Intergovernmental Panel on Climate Change (IPCC) released the Working Group I contribution to the Sixth Assessment Report which will arrive fully in 2022. Among the reaffirmed findings in the report is that we are already most of the way to the 1.5 degree Celsius threshold over pre-industrial global temperatures where climate-related damage becomes more widespread and harder to turn back. We wanted to examine what that means in practical human terms. According to NOAA (R. Lindsey, Jan. 25, 2021), we have seen 8 – 9 inches of sea level rise since 1880, and in some ocean basins nearly that much just since the beginning of the satellite record. Taking the IPCC findings into account and with NOAA’s own models, sea level could rise another foot over 2000 levels by the end of the century. The two images provided are from NOAA’s Sea Level Rise Viewer. The first is a view of the heart of the Northeast Corridor from Long Island Sound down to the Chesapeake at the current “Mean Higher High Water”. The principal shading illustrates the population vulnerability to sea level rise. The second is the same view under a 1 foot MHHW scenario. Note the amount of coastal inundation, particularly around high density and vulnerable populations. The amount of property and population at risk in human and dollar terms is staggering in this relatively concentrated area, and has implications for municipalities, commercial real estate, infrastructure, corporations, maritime interests, tourism, and residential neighborhoods, and all the supply chains and institutions elsewhere like banks and insurance companies that are exposed to that risk. Smart investing requires thinking about mitigation, resiliency, and adaptation, hallmarks of ESG investing and increasingly becoming part of mainstream investing.

WCM Chart of the Week for July 20, 2021

And we’re back. Everyone here is hoping everyone out there has taken some time to breathe a little of the relatively COVID-free air and begin to think about what a return to (the new) normal looks like. In that spirit, this week’s chart is from data provided by Redfin, a national real estate brokerage, on Q1 2021 relocation searches. One of the consequential impacts of COVID and the shutdown was an acceleration of outward migration from major urban centers. We are at a point in the generational cycle where it was to be expected with Millennials anyway, but the urgency was ramped up considerably. With companies reimagining what a workforce and a workplace look like, many people with knowledge economy jobs are able to quite literally work from anywhere. Residential real estate in less urban, less expensive and more desirable areas like Denver, CO (this week’s chart) have seen a crush of interest from urban economic centers and a rapid rise in prices as a result. We envision some of this will reverse, but much of the population movement is likely permanent, changing the economics of numerous communities across the country.

WCM Chart of the Week for June 8, 2021 — UN World Oceans Day

We held this week’s chart until today to coincide with UN World Oceans Day, which lines up well with SDG 14 Life Below Water as well as several other SDGs relating to climate, food and waste. The chart comes from the Food and Agriculture Organization of the UN’s 3rd assessment of global marine fisheries discards (2019), illustrating the thousands of metric kilotonnes of discard by ocean region. Although with a variety of supervisory regimes and certifications and consumer scrutiny the amount of discard and bycatch in commercial fishing is believed to be on the decline, the reality is that the overall annual volume is still alarmingly high. From bottom-feeders to apex predators, the incidental injury to or death of sea animals is not only cruel, it risks destabilizing a critical part of the global food system for humans and irreversibly disrupting an essential part of the global climate system. Consumers and companies can and should continue to exert pressure on seafood businesses to improve the sustainability of their supply chains because it is good for people, planet AND profit. #worldoceansday #bycatch #SDG14

WCM announces ESG Week — June 14 – 18, 2021

5 days. 5 topics. All ESG. How do we take steps toward a more prosperous, just and regenerative world? WCM ESG Week coming June 14 – 18, 2021. (1) Banking the Un/der Banked; (2) The Business of Human Trafficking; (3) Medical Justice and Access to Healthcare; (4) Regenerative Agriculture; (5) Climate Justice.

Watch our introductory video here, and follow us for more details to come on the week and each theme.

« Older posts Newer posts »