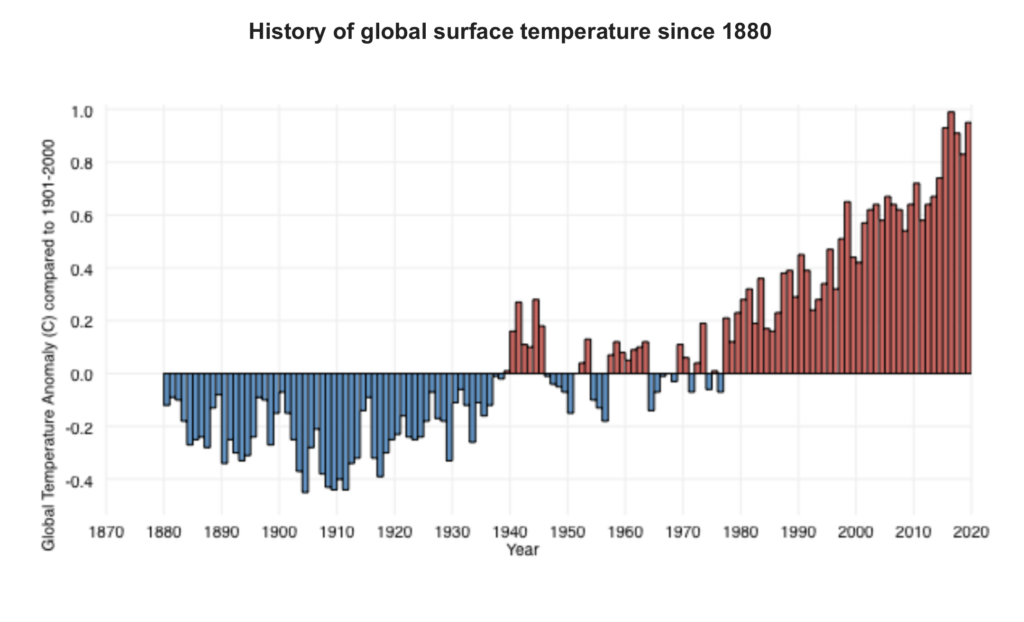
As we close out Climate Week, we need to check in on global temperature. It is climbing. Climate scientists, environmental advocates, legislators, etc. have taken to talking about “climate change” because there has been so much rhetorical pushback about “global warming”. But as the data shows, global average annual temperatures are demonstrably higher as compared to the long-term average over the last century, and decisively trending higher from the pre-Industrial period. In finance we use charts that look like this to argue the benefits of investing in stocks. Trend followers would consider this a definitive and stable factor. Climate change is the outcome and global warming is the driving factor. From a capital markets point of view a professional investor would be derelict for ignoring this data. Scientists still believe mean reversion is possible if we withdraw greenhouse gases (GHGs) from the system. Prudent investment involves deploying capital for mitigation – the reduction in GHGs to reduce climate volatility – and resilience – improving infrastructure, businesses and communities to be able to handle or ideally prevent climate-related damage. [chart courtesy NOAA, August 2020 – https://www.climate.gov/news-features/understanding-climate/climate-change-global-temperature]
“Global warming: the long-term heating of Earth’s climate system… due to human activities, primarily the burning of fossil fuels, which increases heat-trapping greenhouse gas levels in Earth’s atmosphere,” (Shaftel, 2020). The term coined decades ago has gained momentum in not only scientific communities and environmental organizations, but political campaigns and industry corporate governance policies around the globe. From polar ice melting and sea levels rising to extreme weather events, our changing climate has far reaching and compounding effects on the environment and ecosystems, our economies and industries, and our global food supply. One of the direct effects of climate change and global warming is ocean acidification.
To examine the process of ocean acidification and its impacts on human life, recall an adolescent science lesson on pH and water chemistry. The pH scale runs from 0-14, with 7 being neutral. Higher than 7 represents a basic or “alkaline” pH and lower than 7 represents an acidic concentration. For reference, household vinegar, an acidic liquid, has an average pH of 2.5, while tap water has an average pH of 7.5. The ocean’s current pH is approximately 8.1, which is basic (NOAA, 2020). How does the ocean’s pH tie into global warming and climate change?
The ocean naturally absorbs roughly 30% of the carbon dioxide that is released into the atmosphere. When seawater and carbon dioxide combine, carbonic acid is produced, lowering the pH of the ocean and increasing the acidity. As levels of carbon dioxide increase due to human activity (burning of fossil fuels, land-use change and deforestation, agricultural industries) the amount of CO2 absorbed by the ocean also increases. Plainly speaking, the more CO2 we produce and release into the atmosphere, the more acidic our oceans become. Since the Industrial Revolution in the 1700’s, increases in CO2 have resulted in a 30% increase in ocean acidity (NOAA, 2020). This present acidification process is occurring ten times faster than any previous changes over the last 300 million years (IUCN, 2017). The rapid acceleration of CO2 production significantly jeopardizes the ability of ecosystems to effectively adapt to the changes in ocean chemistry.
Increased ocean acidity especially affects organisms with calcium carbonate shells or skeletons including shellfish like coral, oysters, crab, and lobster. A recent study performed by the National Oceanic and Atmospheric Administration on the pteropod, a small sea snail integral to the ocean food chain, showed that the levels of ocean pH projected for year 2100 dissolve the organism’s shell within just 45 days. Furthermore, researchers have already discovered severe shell dissolution in pteropods naturally found in the Southern (Antarctic) Ocean, indicating the process’ rapid progression (NOAA, 2020). The pteropod snail is a major food source affecting members of the food chain from krill and fish to whales and seals. When we consider how each organism is interconnected in the food web, the loss of one species creates a cascading effect.
Unfortunately, the consequences do not stop there. Increased acidity has also been linked to a disturbance in scent transmission, inhibiting species from detecting predators and locating suitable habitats (NOAA, 2020). Acidification has also been observed to affect sound transmission, reducing sound absorption and increasing the ocean’s ambient noise (OAN). Increases in OAN can impair marine animals’ hearing and communication, increase stress and lower their immune systems, and even cause brain hemorrhaging or death in severe cases (Gazioğlu, 2015).
High Level Impacts
In 2018, the global fishing and seafood sector represented a USD 164 billion international trade industry employing 59.5 million people. 88% of the 179 billion tonnes of total fish produced in 2018 was for direct human consumption. Fish and fish products supply approximately 3.3 billion people with nearly 20 percent of their average per capita intake of animal protein. Furthermore, seafood provides many crucial nutrients to the human diet including long chain Omega-3 fats, iodine, vitamin D, iron, calcium, zinc, and other minerals. With key species like the pteropod in jeopardy, the entire seafood industry risks significant threat, exacerbating global hunger and malnutrition (FOA, 2020). Dying coral systems lack the ability to effectively buffer coastal communities from storm waves and erosion, and leave those communities to suffer consequences to tourism and commercial business (IUCN, 2017). Profits, careers, economies, biodiversity, ecosystem structure, shoreline integrity, and global food supply are all threatened if ocean acidification continues to accelerate due to increased CO2 production.
As managers of sustainable and responsible investment portfolios, our passion lies not only in providing ethically sourced returns for our clients, but in supporting positive impact-driven companies and communities. Conscious investing is achieved through selective avoidance of institutions that harm ecosystems or using the allocation of capital as a lever to change those institutions, in conjunction with focusing on institutions that provide regenerative and resourceful solutions to humanities’ needs.
Gazioğlu, C., Müftüoğlu, A. E., Demir, V., Aksu, A., & Okutan, V. (2015). Connection between Ocean Acidification and Sound Propagation. International Journal of Environment and Geoinformatics, 2(2), 16–26. https://doi.org/10.30897/ijegeo.303538
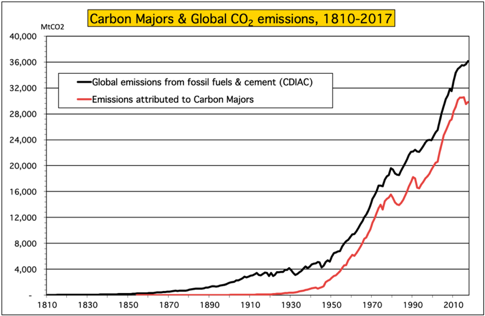
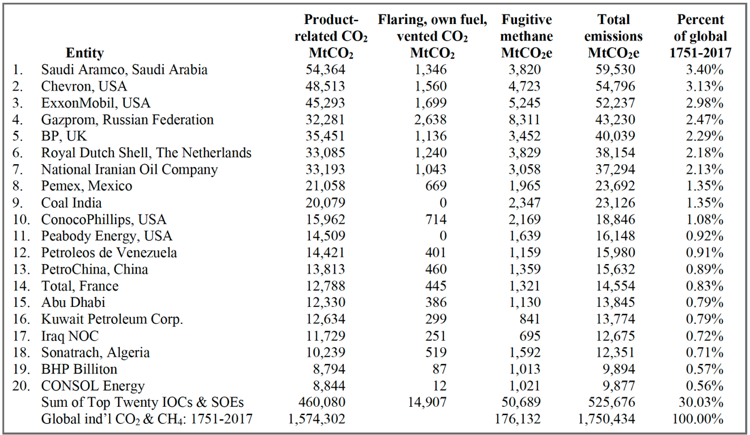
More and more companies, including airlines and oil companies, are announcing an intention to achieve carbon-neutral operations over the next couple decades. But, it is important to look behind the headlines and understand what that sort of pledge actually means. What business is the company actually in and does the pledge include their supply chain or product output? From the Climate Accountability Institute (Oct. 9, 2019, data through 2017), global fossil fuel and cement emissions from 1965 to 2018 totaled 1,354 billion tonnes of carbon dioxide and energy-related methane (GtCO2e); The twenty largest investor-owned and state-owned fossil fuel companies produced carbon fuels that emitted 35% of the global total (480 GtCO2e); Looking over the entire historical data set they find their current database of 103 fossil fuel and cement entities emitted 1,221 GtCO2e, or 69.8% of global since 1751 (1.75 TtCO2e); of which the Top Twenty companies are responsible for 526 GtCO2e, or 30% of all fossil fuel and cement emission since 1751. [Charts and data, Climate Accountability Institute, October 2019]
Climate Accountability Institute, October 2019Climate Accountability Institute, October 2019